Correction (2026-05-29): An earlier version of this article cited Hispanic enrollment of 32,373 in 2005, 80,409 in 2025, a 46,586-student total growth, and a 1,450-student 2026 decline. The Nebraska Department of Education file we drew from pools public school districts with non-public and state-operated entities, and our data package was treating all of them as public school districts. The corrected public-school-only figures are 30,683 Hispanic students in 2005, 76,953 in 2025, a 44,907-student growth, and a 1,363-student 2026 decline. The statewide white share, total enrollment, and "share of total change" figures have also been updated. District-level Hispanic shares (Schuyler, Lexington, South Sioux City, Grand Island, Fremont, Columbus, Crete, OPS, LPS, Millard) are unchanged. Thanks to a reader for flagging this.
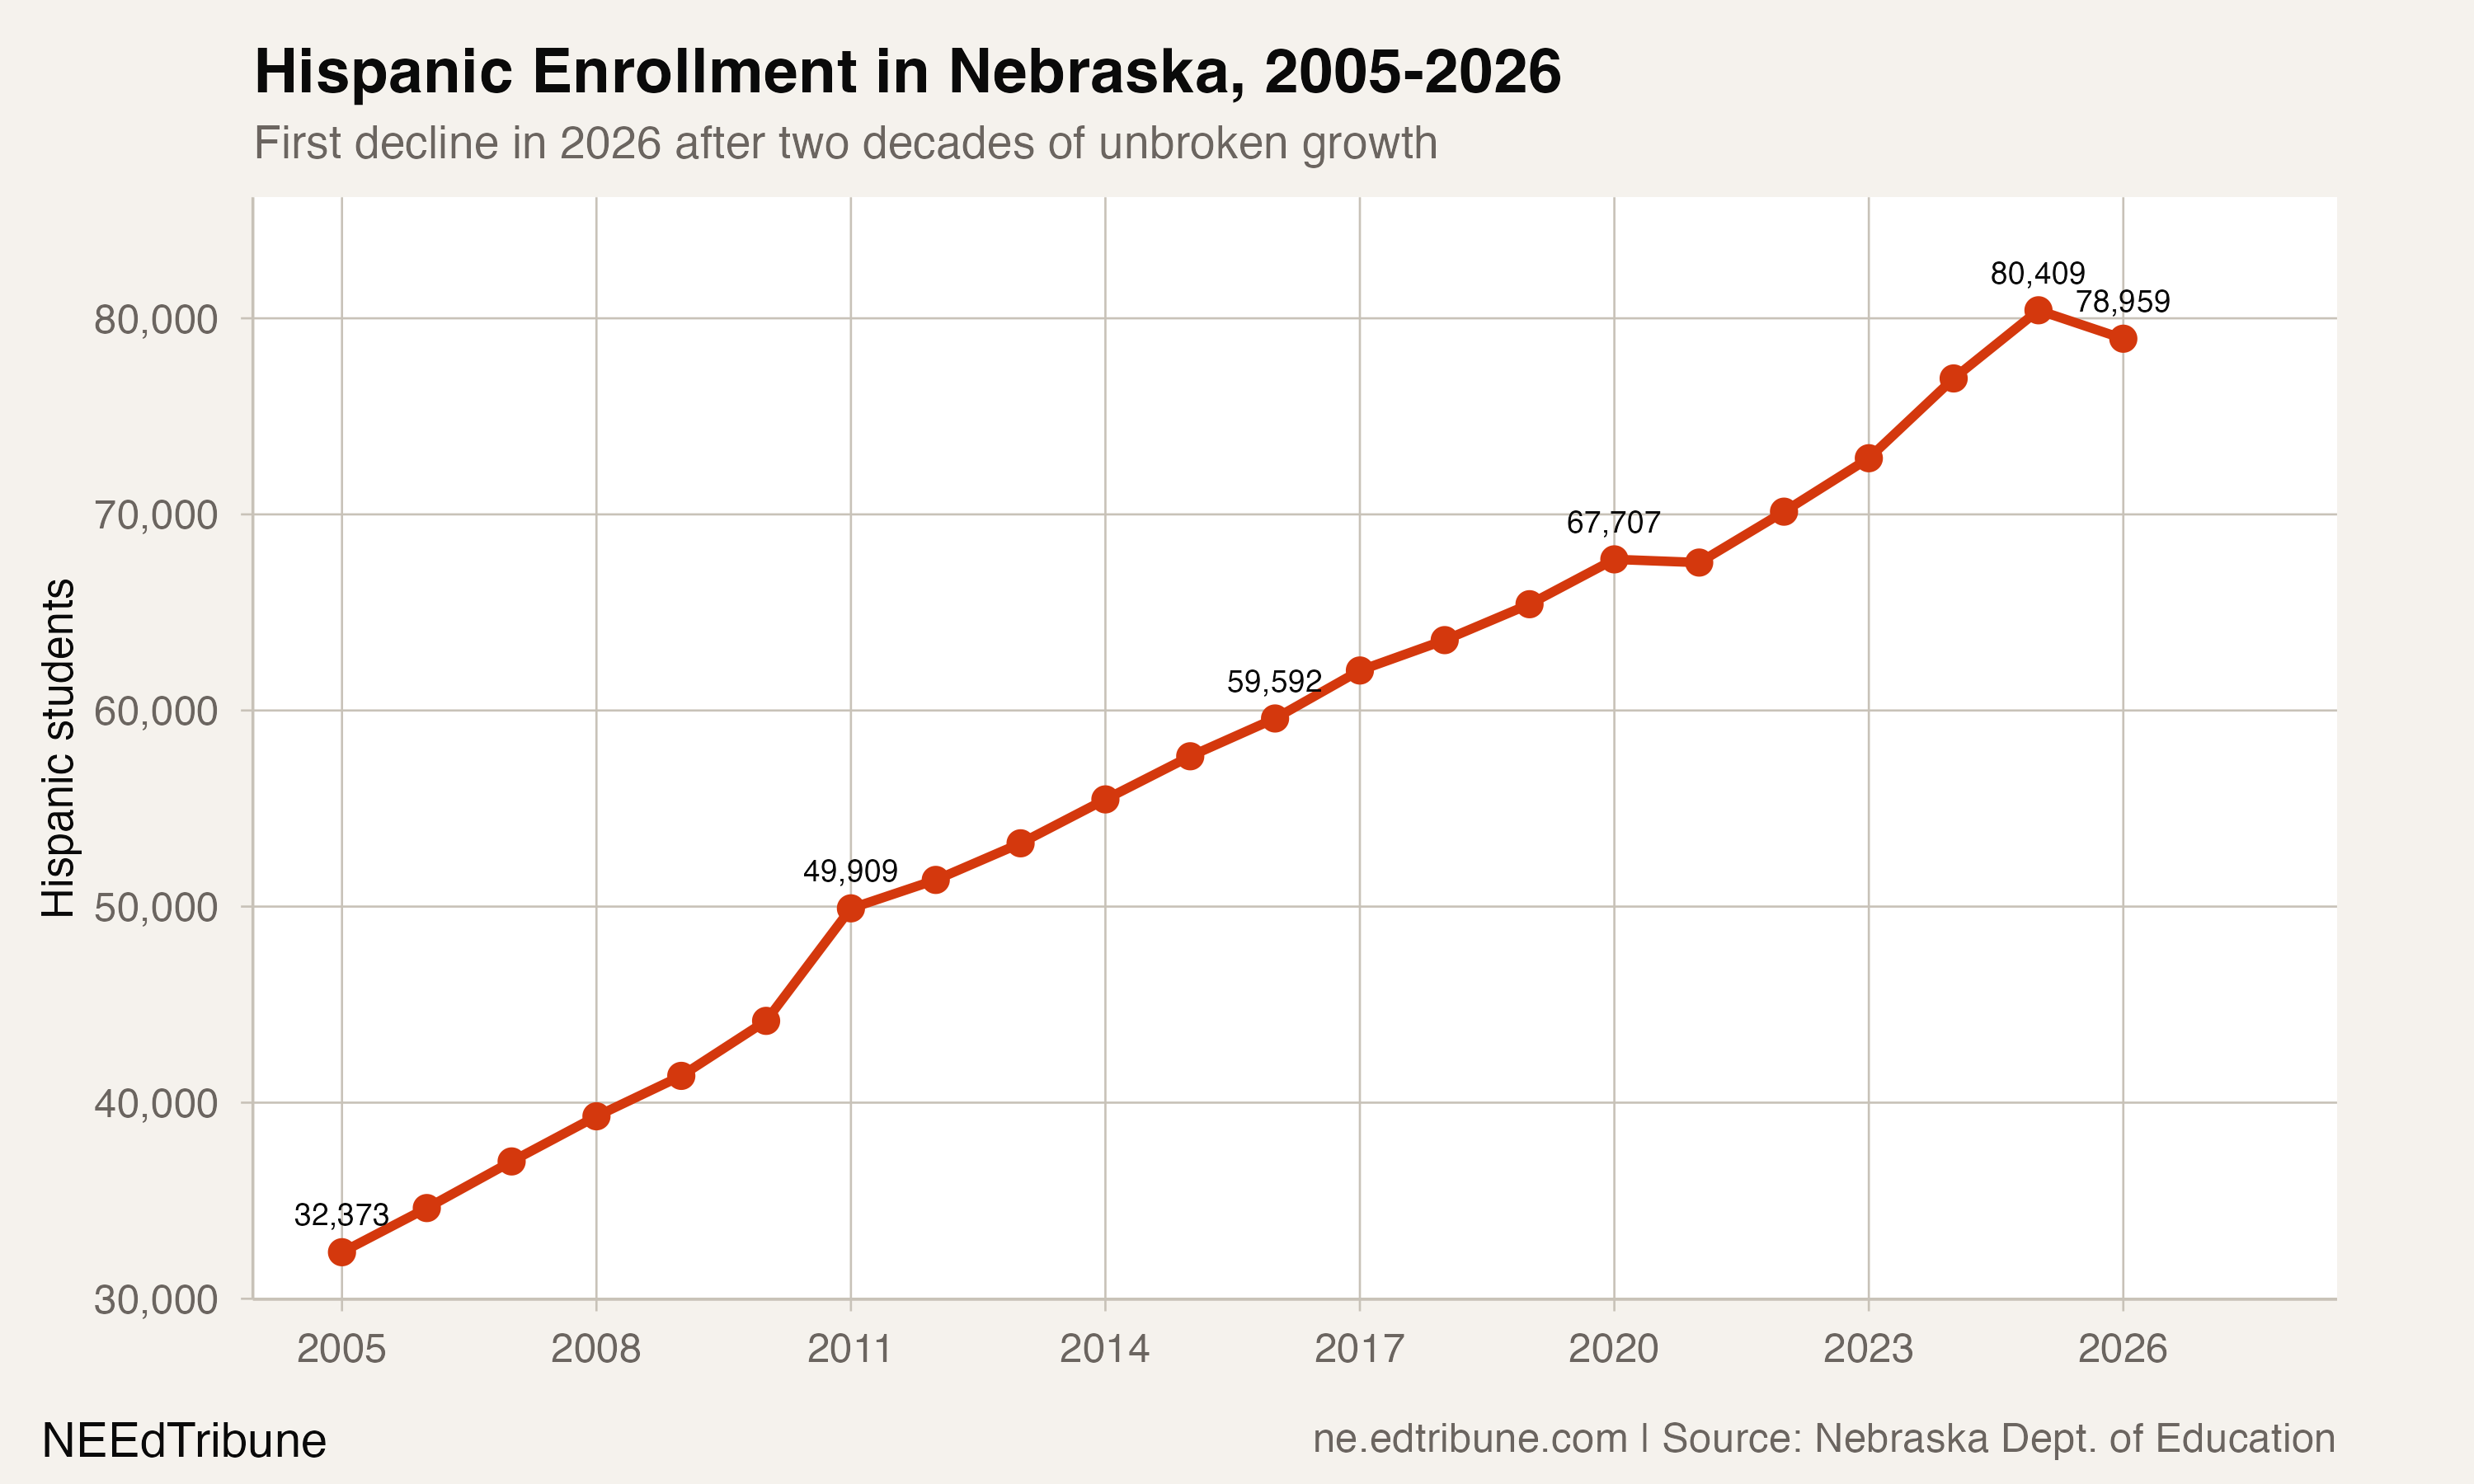
In 2005, about one in nine Nebraska public school students was Hispanic. By 2025, it was closer to one in four. Over those 20 years, Hispanic enrollment rose every single year without exception, adding an average of about 2,300 students annually and growing from 30,683 to 76,953.
Then, in 2026, it stopped. Hispanic enrollment fell by 1,363 students, a 1.8% decline that broke the longest sustained demographic growth streak in Nebraska's enrollment data. The drop came in the same year that ICE arrests in Nebraska surged 329%, though the data cannot establish a direct link between the two.
More than the total
Nebraska's total public school enrollment grew by 43,549 students between 2005 and 2026. Hispanic enrollment grew by 44,907 over the same period, slightly exceeding the net increase. The math is straightforward: white enrollment fell by 23,926 students, so Hispanic gains did not merely contribute to Nebraska's growth. They subsidized the losses of other groups.
Hispanic students now make up 23.0% of Nebraska's enrollment, up from 10.8% in 2005. White students fell from 78.5% to 60.8% over the same span. That 17.7-percentage-point decline in white share is roughly matched by gains spread across Hispanic (+12.2 points), Asian, and multiracial students.

The corridor that started it all
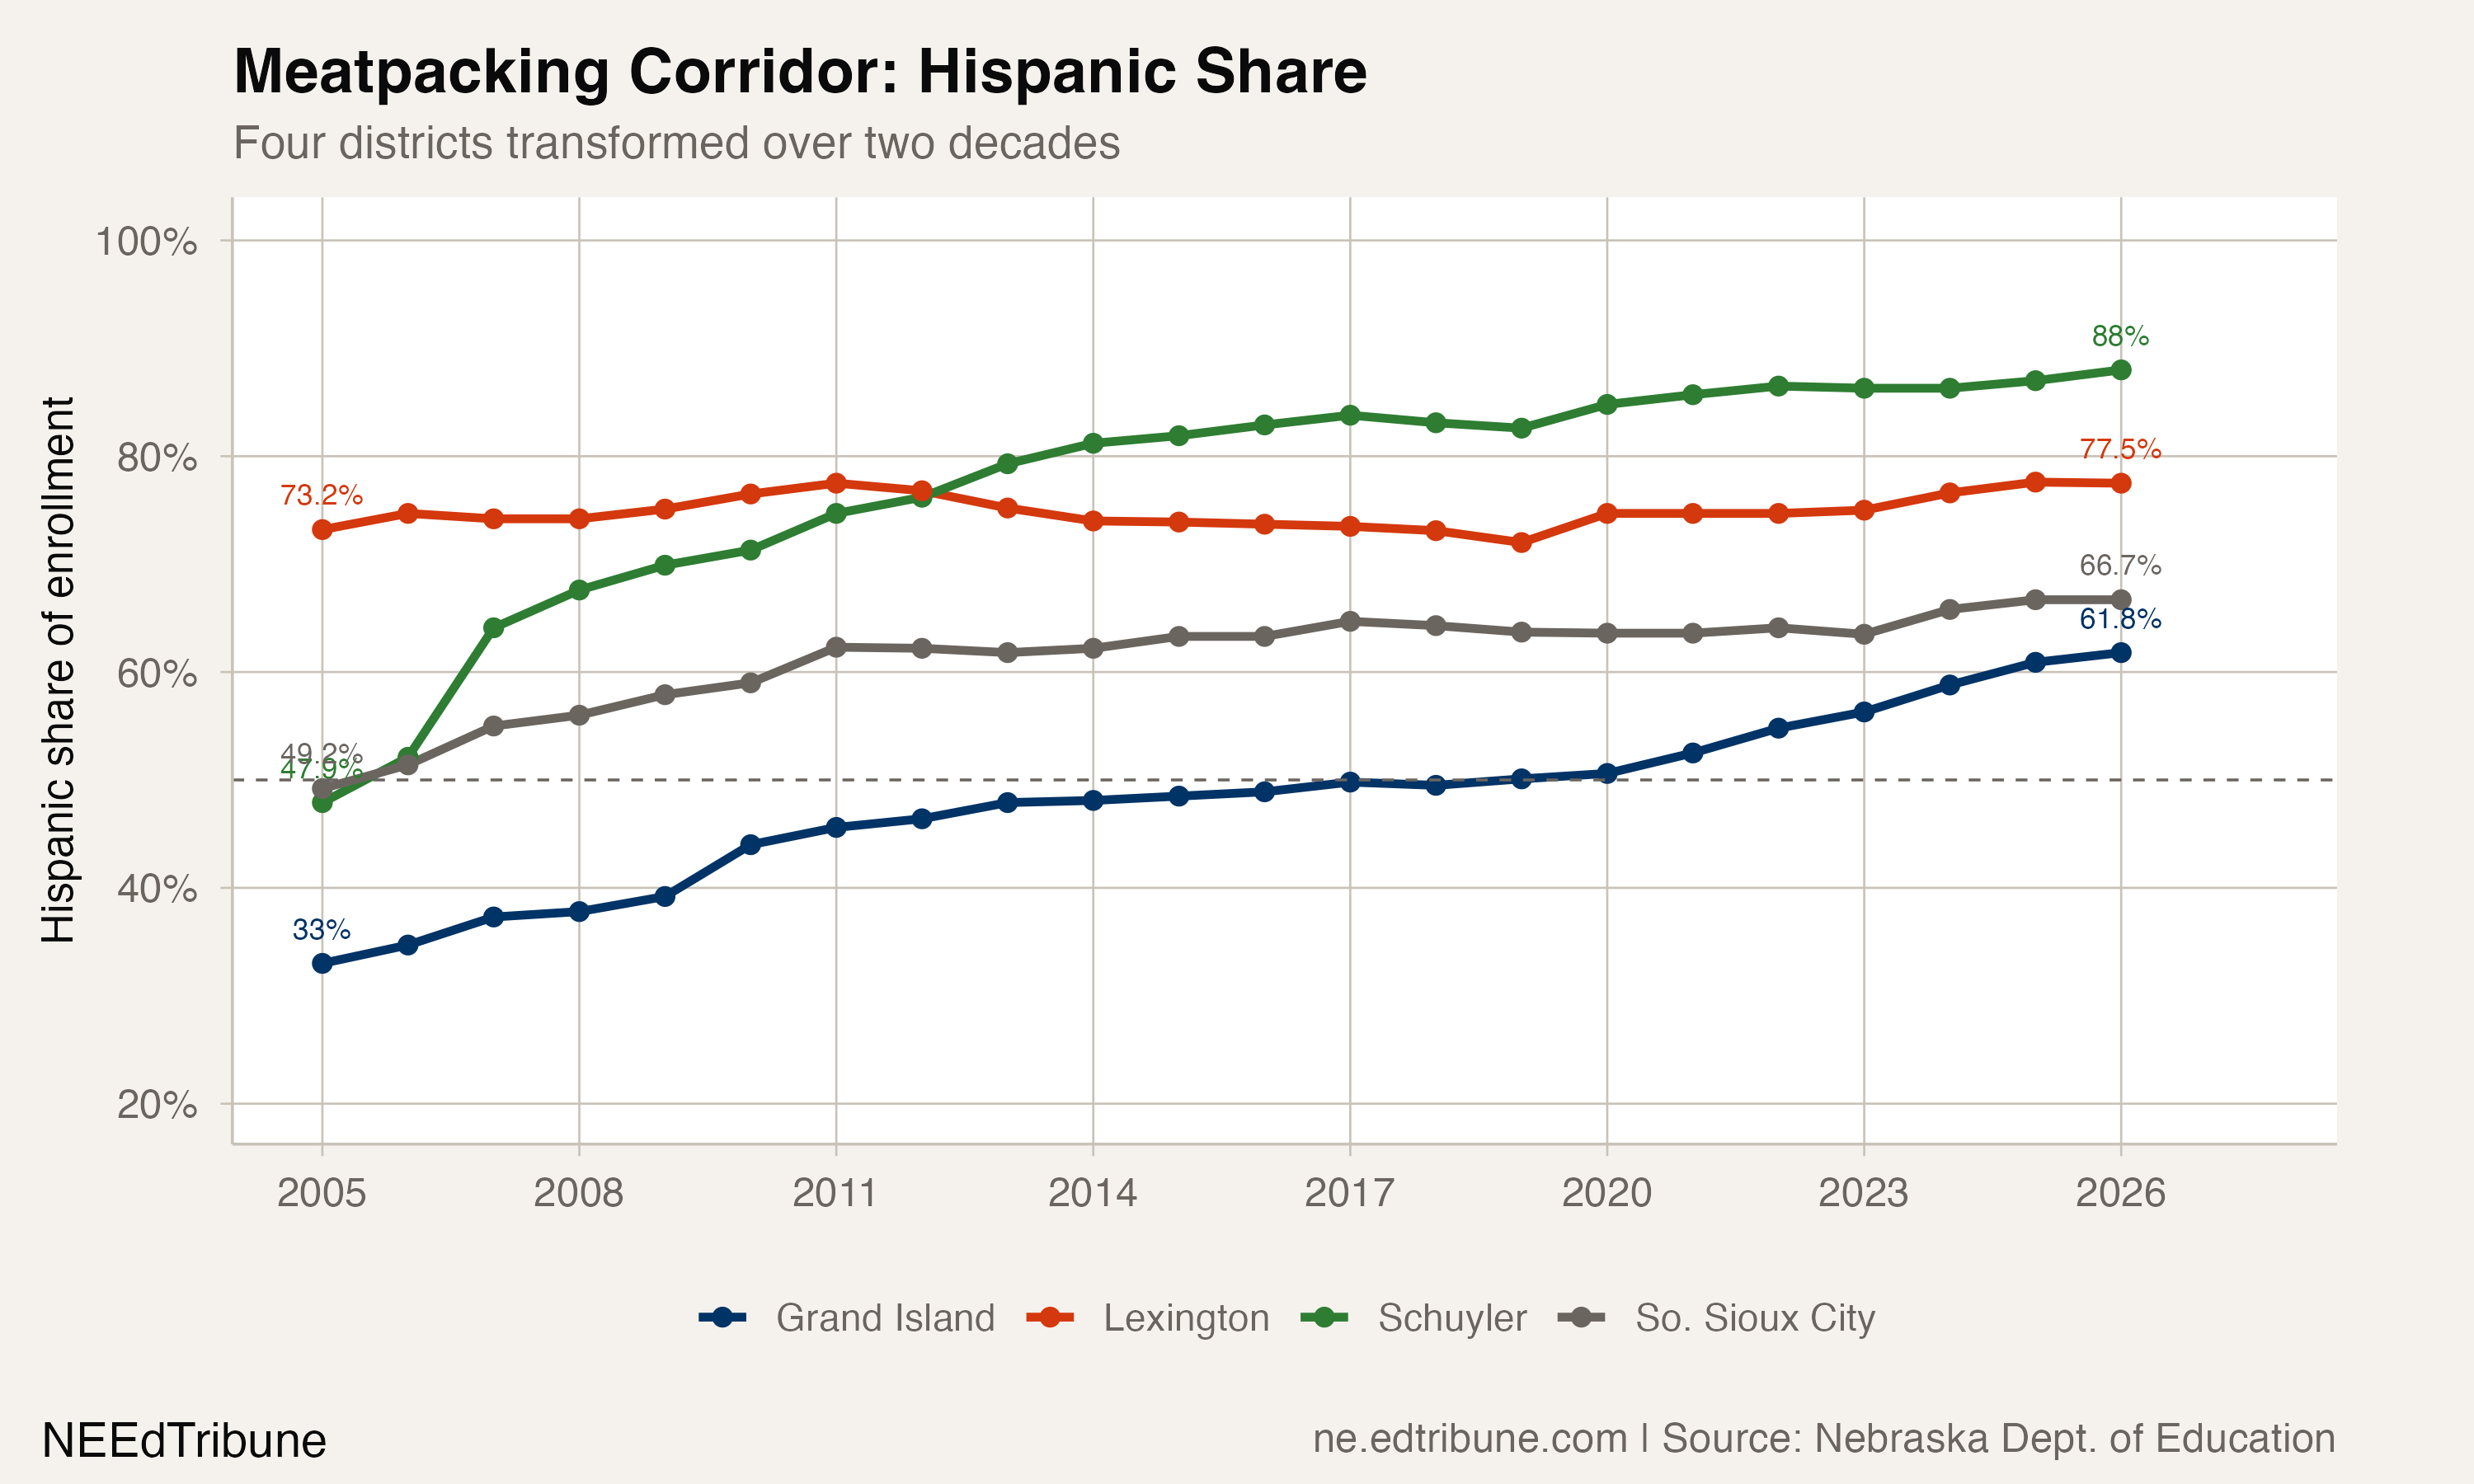
The growth did not arrive evenly. It followed the meatpacking plants.
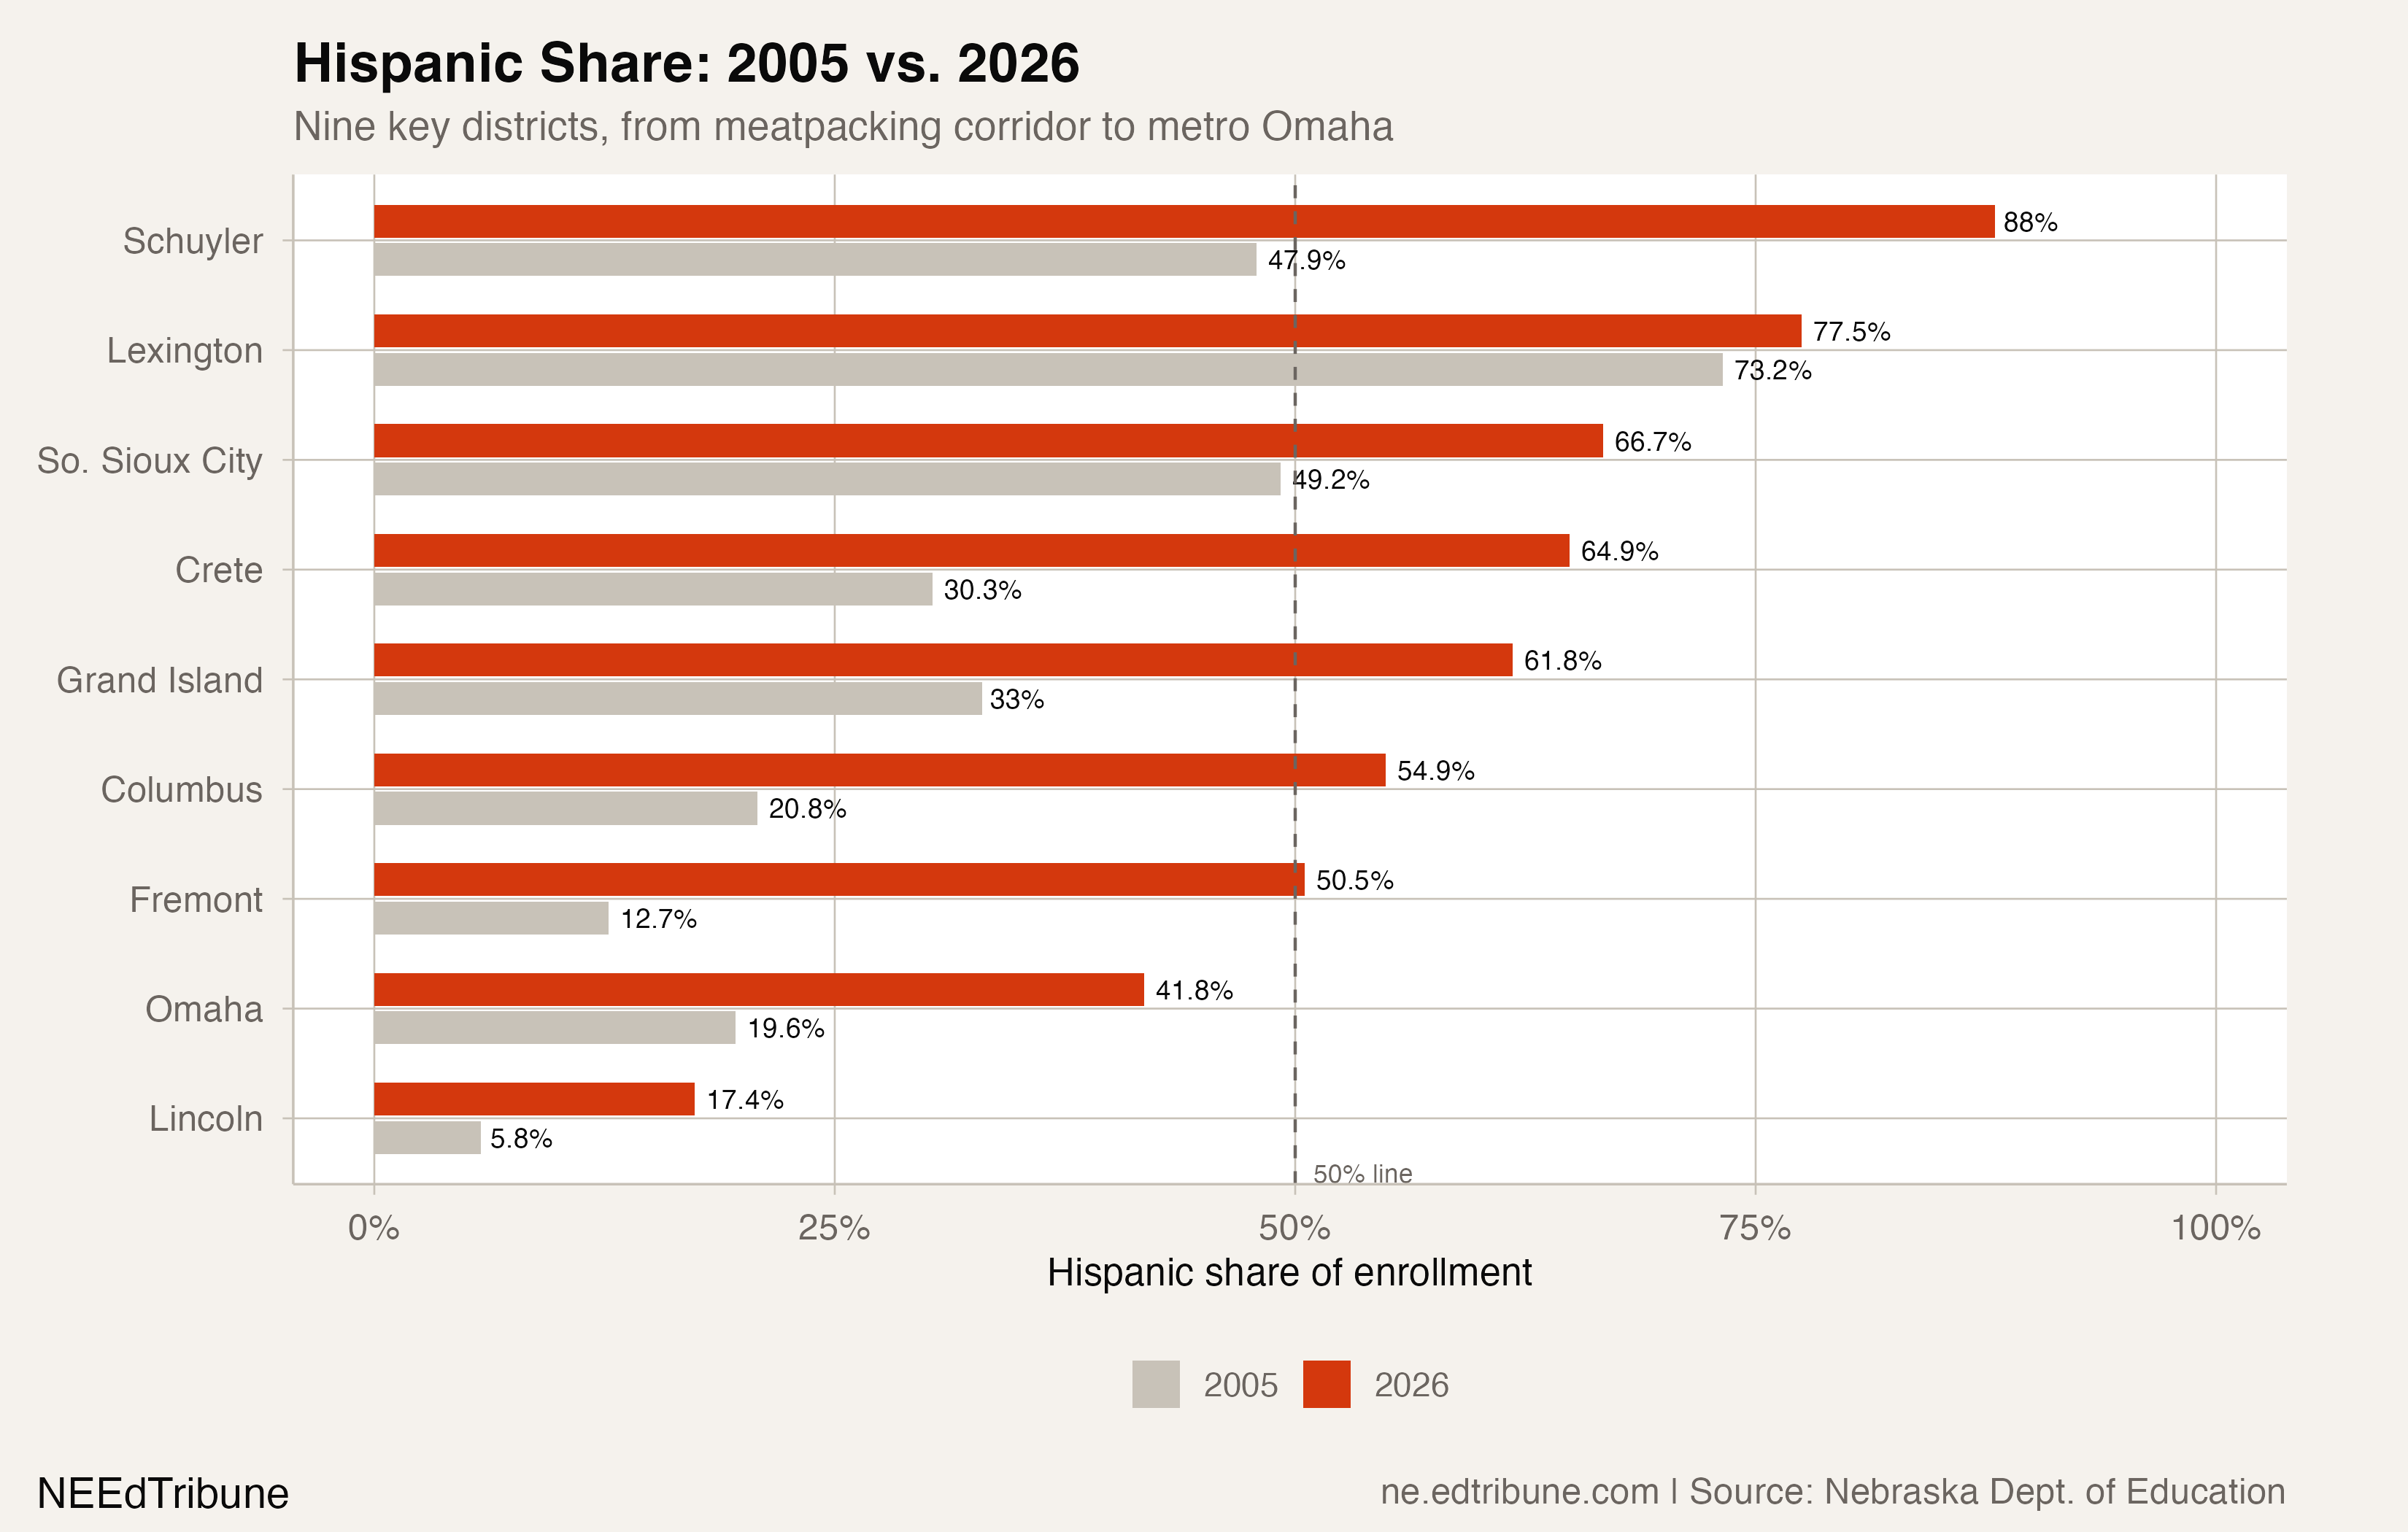
Schuyler Community Schools↗ET, home to a Cargill beef plant, enrolls 1,847 students in 2026. Of those, 1,625 are Hispanic: 88.0%. Lexington Public Schools↗ET, where an IBP plant (now Tyson Fresh Meats) transformed a shrinking agricultural town in the 1990s, is 77.5% Hispanic. South Sioux City Community Schools↗ET, across the Missouri River from Iowa's own meatpacking corridor, is 66.7%. Grand Island Public Schools↗ET, the state's fourth-largest district with 9,744 students, is 61.8% Hispanic, up from 33.0% in 2005.
These four districts represent the first wave. Workers recruited to meatpacking plants in the 1990s and 2000s started families, and second-generation enrollment followed. A Migration Policy Institute study of Nebraska's Latino population found that approximately 35% are second-generation, and 59.2% of that second generation was under 15 years old, meaning the school-age pipeline was built into the state's demographics long before the enrollment data reflected it.
Beyond the plants
The bigger trend now is the spread beyond the original corridor towns into mid-sized districts and Omaha's suburbs.
Fremont Public Schools↗ET crossed 50% Hispanic in 2026 for the first time, reaching 50.5% with 2,632 Hispanic students out of 5,216 total. In 2005, Hispanic students were 12.7% of Fremont's enrollment. Columbus Public Schools↗ET hit 54.9%, up from 20.8%. Crete Public Schools↗ET, a smaller district south of Lincoln, reached 64.9%.
In the state's two largest districts, the trajectory is clear but the timeline is longer. Omaha Public Schools↗ET, with 52,095 students, is now 41.8% Hispanic, up from 19.6% in 2005. That is an increase of 12,621 Hispanic students, more than any other district in the state. Lincoln Public Schools↗ET went from 5.8% to 17.4%, adding 5,409 Hispanic students. Millard Public Schools, a suburban Omaha district, saw Hispanic enrollment grow 418.9%, from 523 to 2,714.
Ten districts with at least 100 students are now majority-Hispanic, a category that did not exist in meaningful numbers two decades ago.
The 2011 anomaly
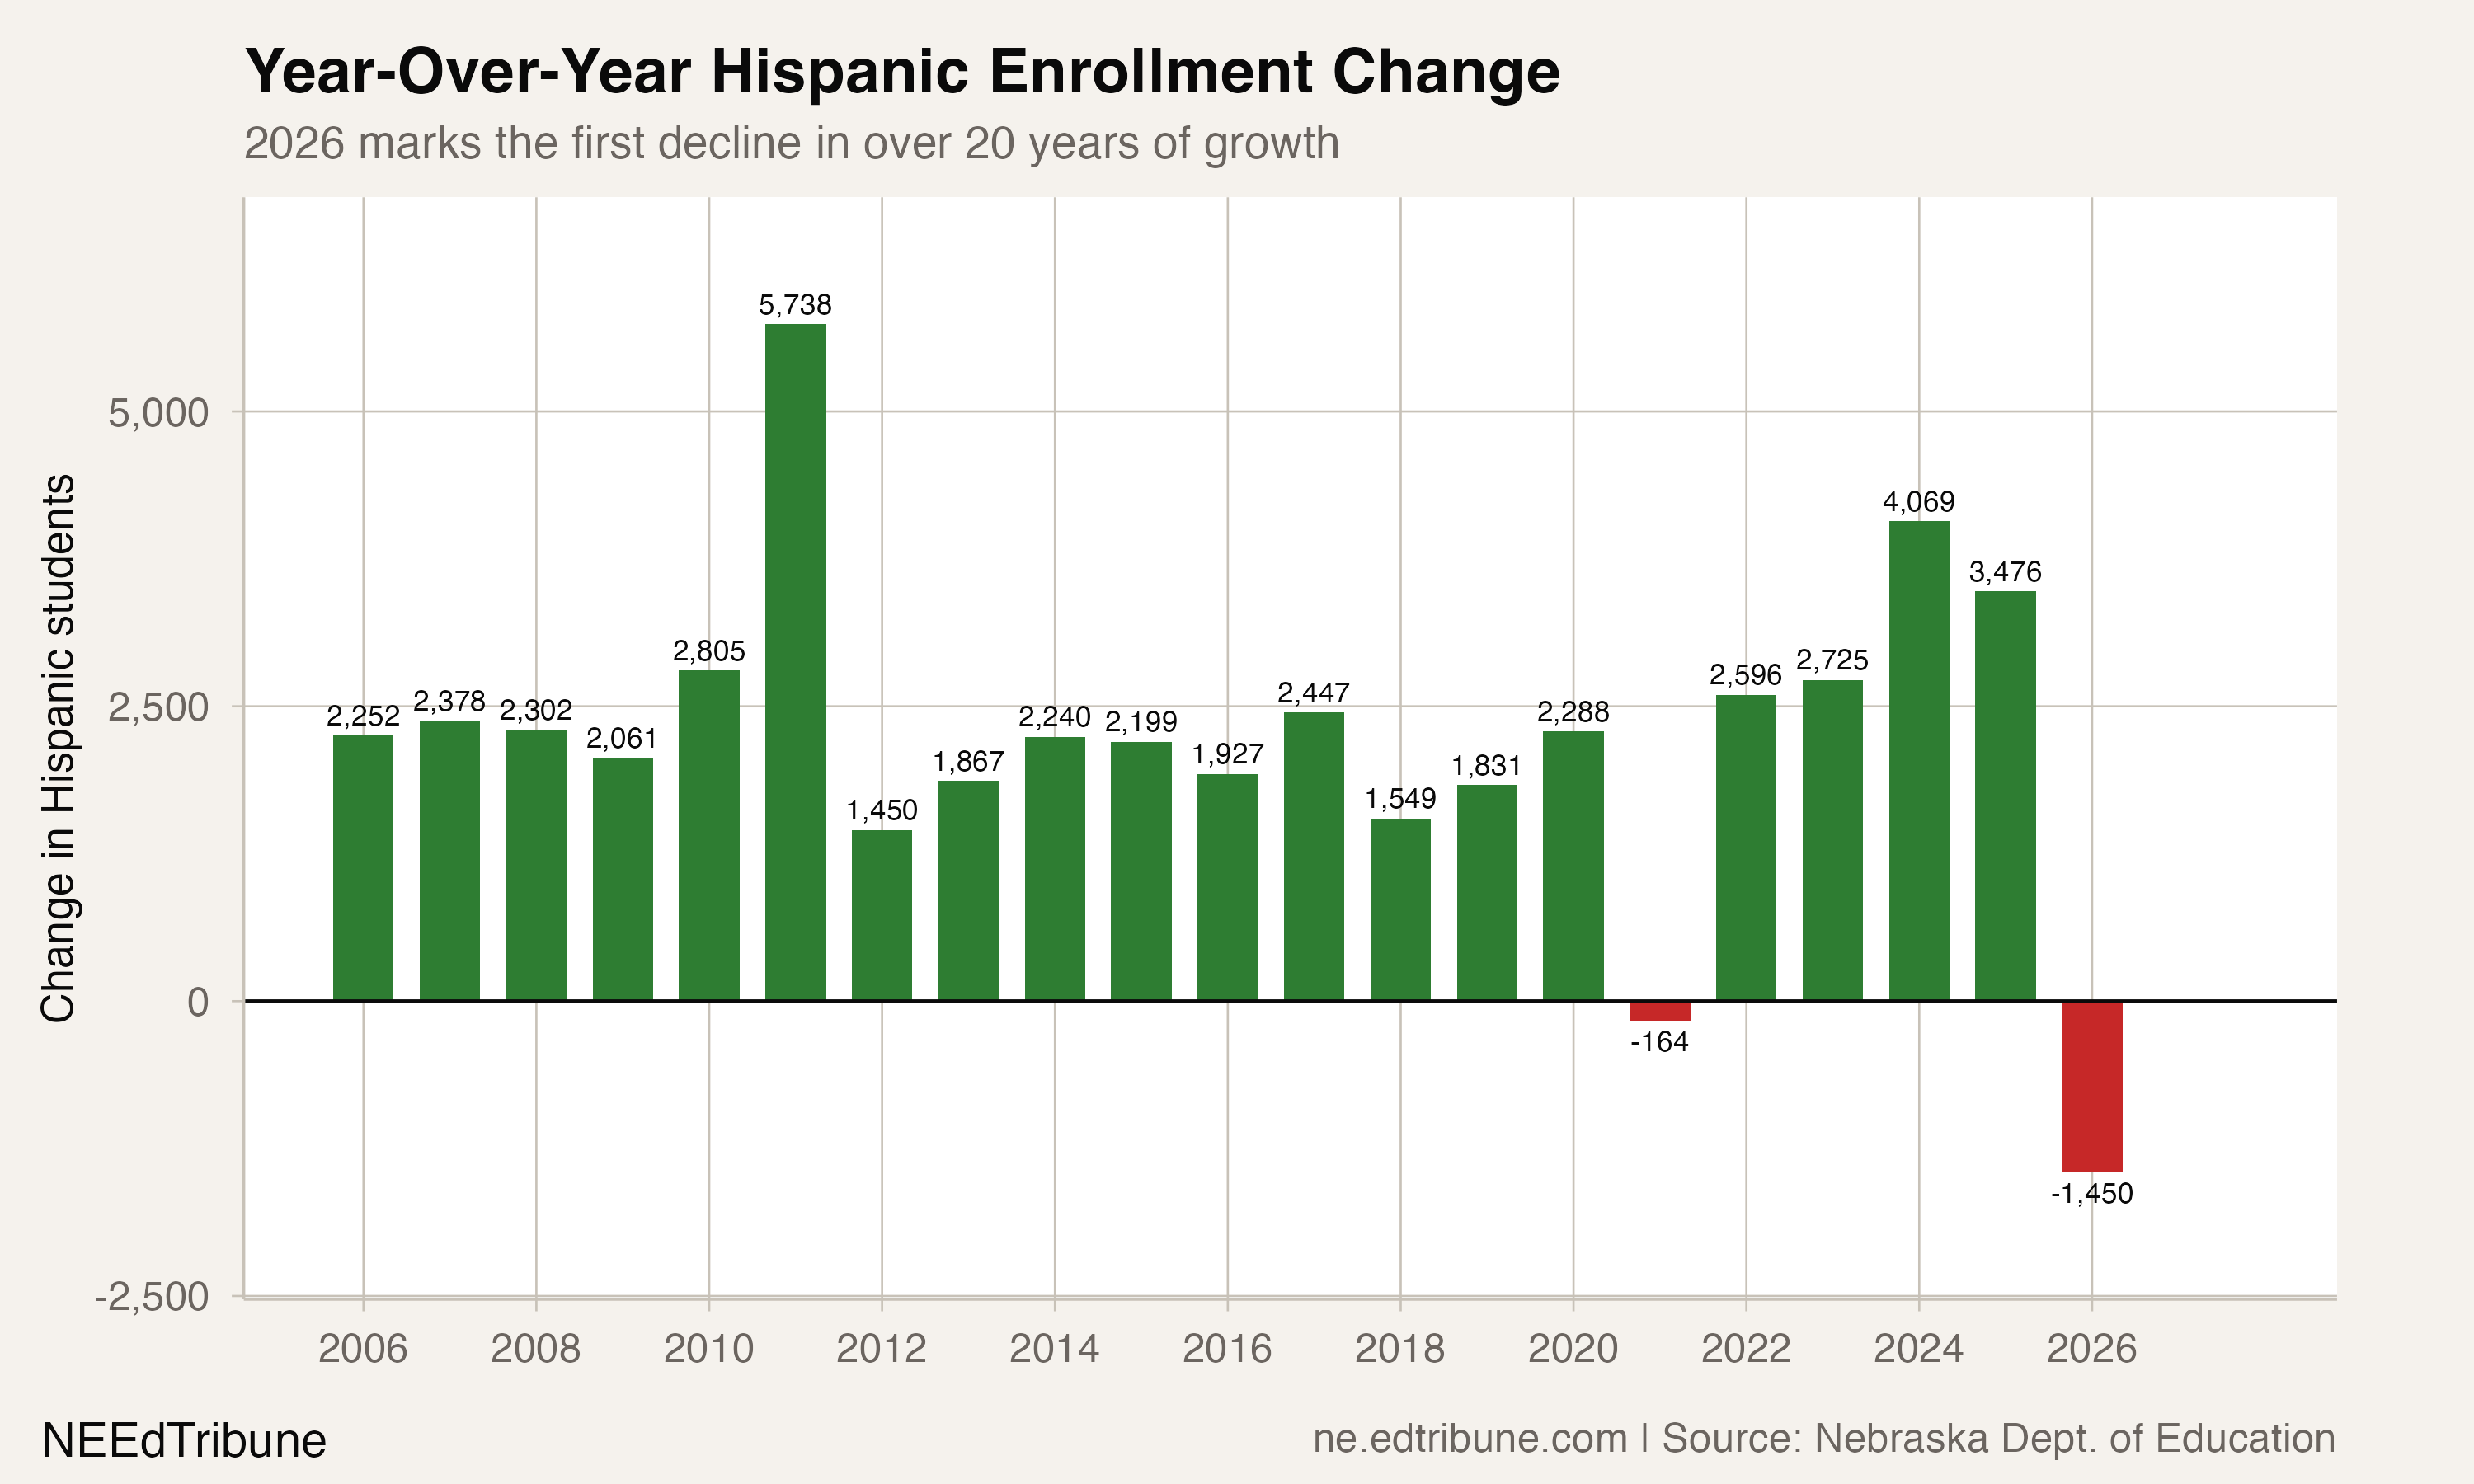
The year-over-year data shows one conspicuous spike: a gain of 5,738 Hispanic students in 2011, more than double the typical annual increase of around 2,200. That 13.0% single-year jump coincided with a change in how Nebraska reported race and ethnicity data, aligning with federal standards that allowed students to identify with multiple racial categories. Some students previously counted as multiracial or "other" were reclassified as Hispanic.
This matters because it inflates the apparent growth rate in that year. The underlying trend of roughly 2,000 to 2,500 new Hispanic students per year was consistent before and after 2011. The spike was a reporting artifact, not a sudden wave of arrivals.
What 2026 broke
After two decades of unbroken growth, Hispanic enrollment fell by 1,363 students in 2026. This was only the second year-over-year decline in the 22-year dataset. The first, in 2021, was a 55-student dip during the pandemic, statistically indistinguishable from flat.
The 2026 decline is more than 20 times larger and arrives in a very different context. Between January and October 2025, ICE detained 1,246 people in Nebraska, up from 291 in the same period of 2024. Sixteen percent of 2025 detainees had no criminal record, up from 8% in 2024.
A UC Riverside survey of 606 high school principals found that 63.8% reported immigrant students missing school due to fears of enforcement. A Nebraska principal specifically noted that "students weren't eating properly because their parents were afraid to leave the house." Another reported that "some students stopped attending school regularly because they had to stay home with younger siblings after a parent was detained."
"The spaces that used to be safe, where people felt like they could congregate... are no longer safe spaces." -- Roxana Cortes-Mills, legal director, as quoted in The Reader, March 2026
Whether the enrollment dip reflects families leaving the state, families withdrawing children from public schools, or simply a demographic plateau is impossible to determine from enrollment data alone. The 2026 data captures a single year. It could be a temporary disruption or the start of a structural reversal.
The corridor's ceiling and the cities in between
The enrollment data shows who enrolled. It does not show who did not. If families withdrew children because of immigration fears, those students might have moved to another state, enrolled in private school, or simply stopped showing up. Nebraska does not track the reason a student leaves a public school system.
The meatpacking corridor districts where the growth began may also be approaching a saturation point. Schuyler is already 88% Hispanic. Lexington is 77.5%. In districts where the demographic transition happened decades ago, total enrollment now depends less on Hispanic growth than on whether the underlying community can hold its population at all.
The districts to watch are the ones in the middle of their transitions: Fremont, which just crossed 50%. Columbus, at 54.9%. Grand Island, the largest district in the corridor, where Hispanic share has nearly doubled from 33% to 61.8% in 22 years. In these communities, the composition of the student body is changing faster than the composition of the teaching workforce, a gap that districts nationally are struggling to close.
Nebraska added 44,907 Hispanic students over 22 years. That growth subsidized every white departure, papered over every rural loss, and turned the state into a Midwestern outlier that gained enrollment while its neighbors declined. In 2026, for the first time, the subsidy stopped. What happens in the Fremont Hormel plant, the Grand Island JBS floor, and the South Sioux City Tyson line will show up in kindergarten rosters before it shows up anywhere else.
Detailed code that reproduces the analysis and figures in this article is available exclusively to EdTribune subscribers.
Discussion
Sign in to join the discussion.
Loading comments...