Correction: This prepublication draft understated the weighted graduation rate for Nebraska's four largest district cohorts, omitted two districts from the list of perfect rates with cohorts of at least 50, and presented demographic explanations that the analysis did not test. The article has been recomputed and narrowed to what the graduation records show.
Nebraska's 2025 graduation file contains 223 usable district rows. Of those, 128 — 57.4% — reported four-year graduation rates of at least 95%. Seventy reported 100%.
Those district counts describe how often a rate appears, not how many students it represents. The 128 districts at or above 95% enrolled 6,718 students, or 28.2% of the 23,816 students covered by the usable district rows. The 70 perfect-rate districts enrolled 1,641 students, or 6.9%.
That denominator difference is the central finding: a district-count view and a student-weighted view answer different questions.
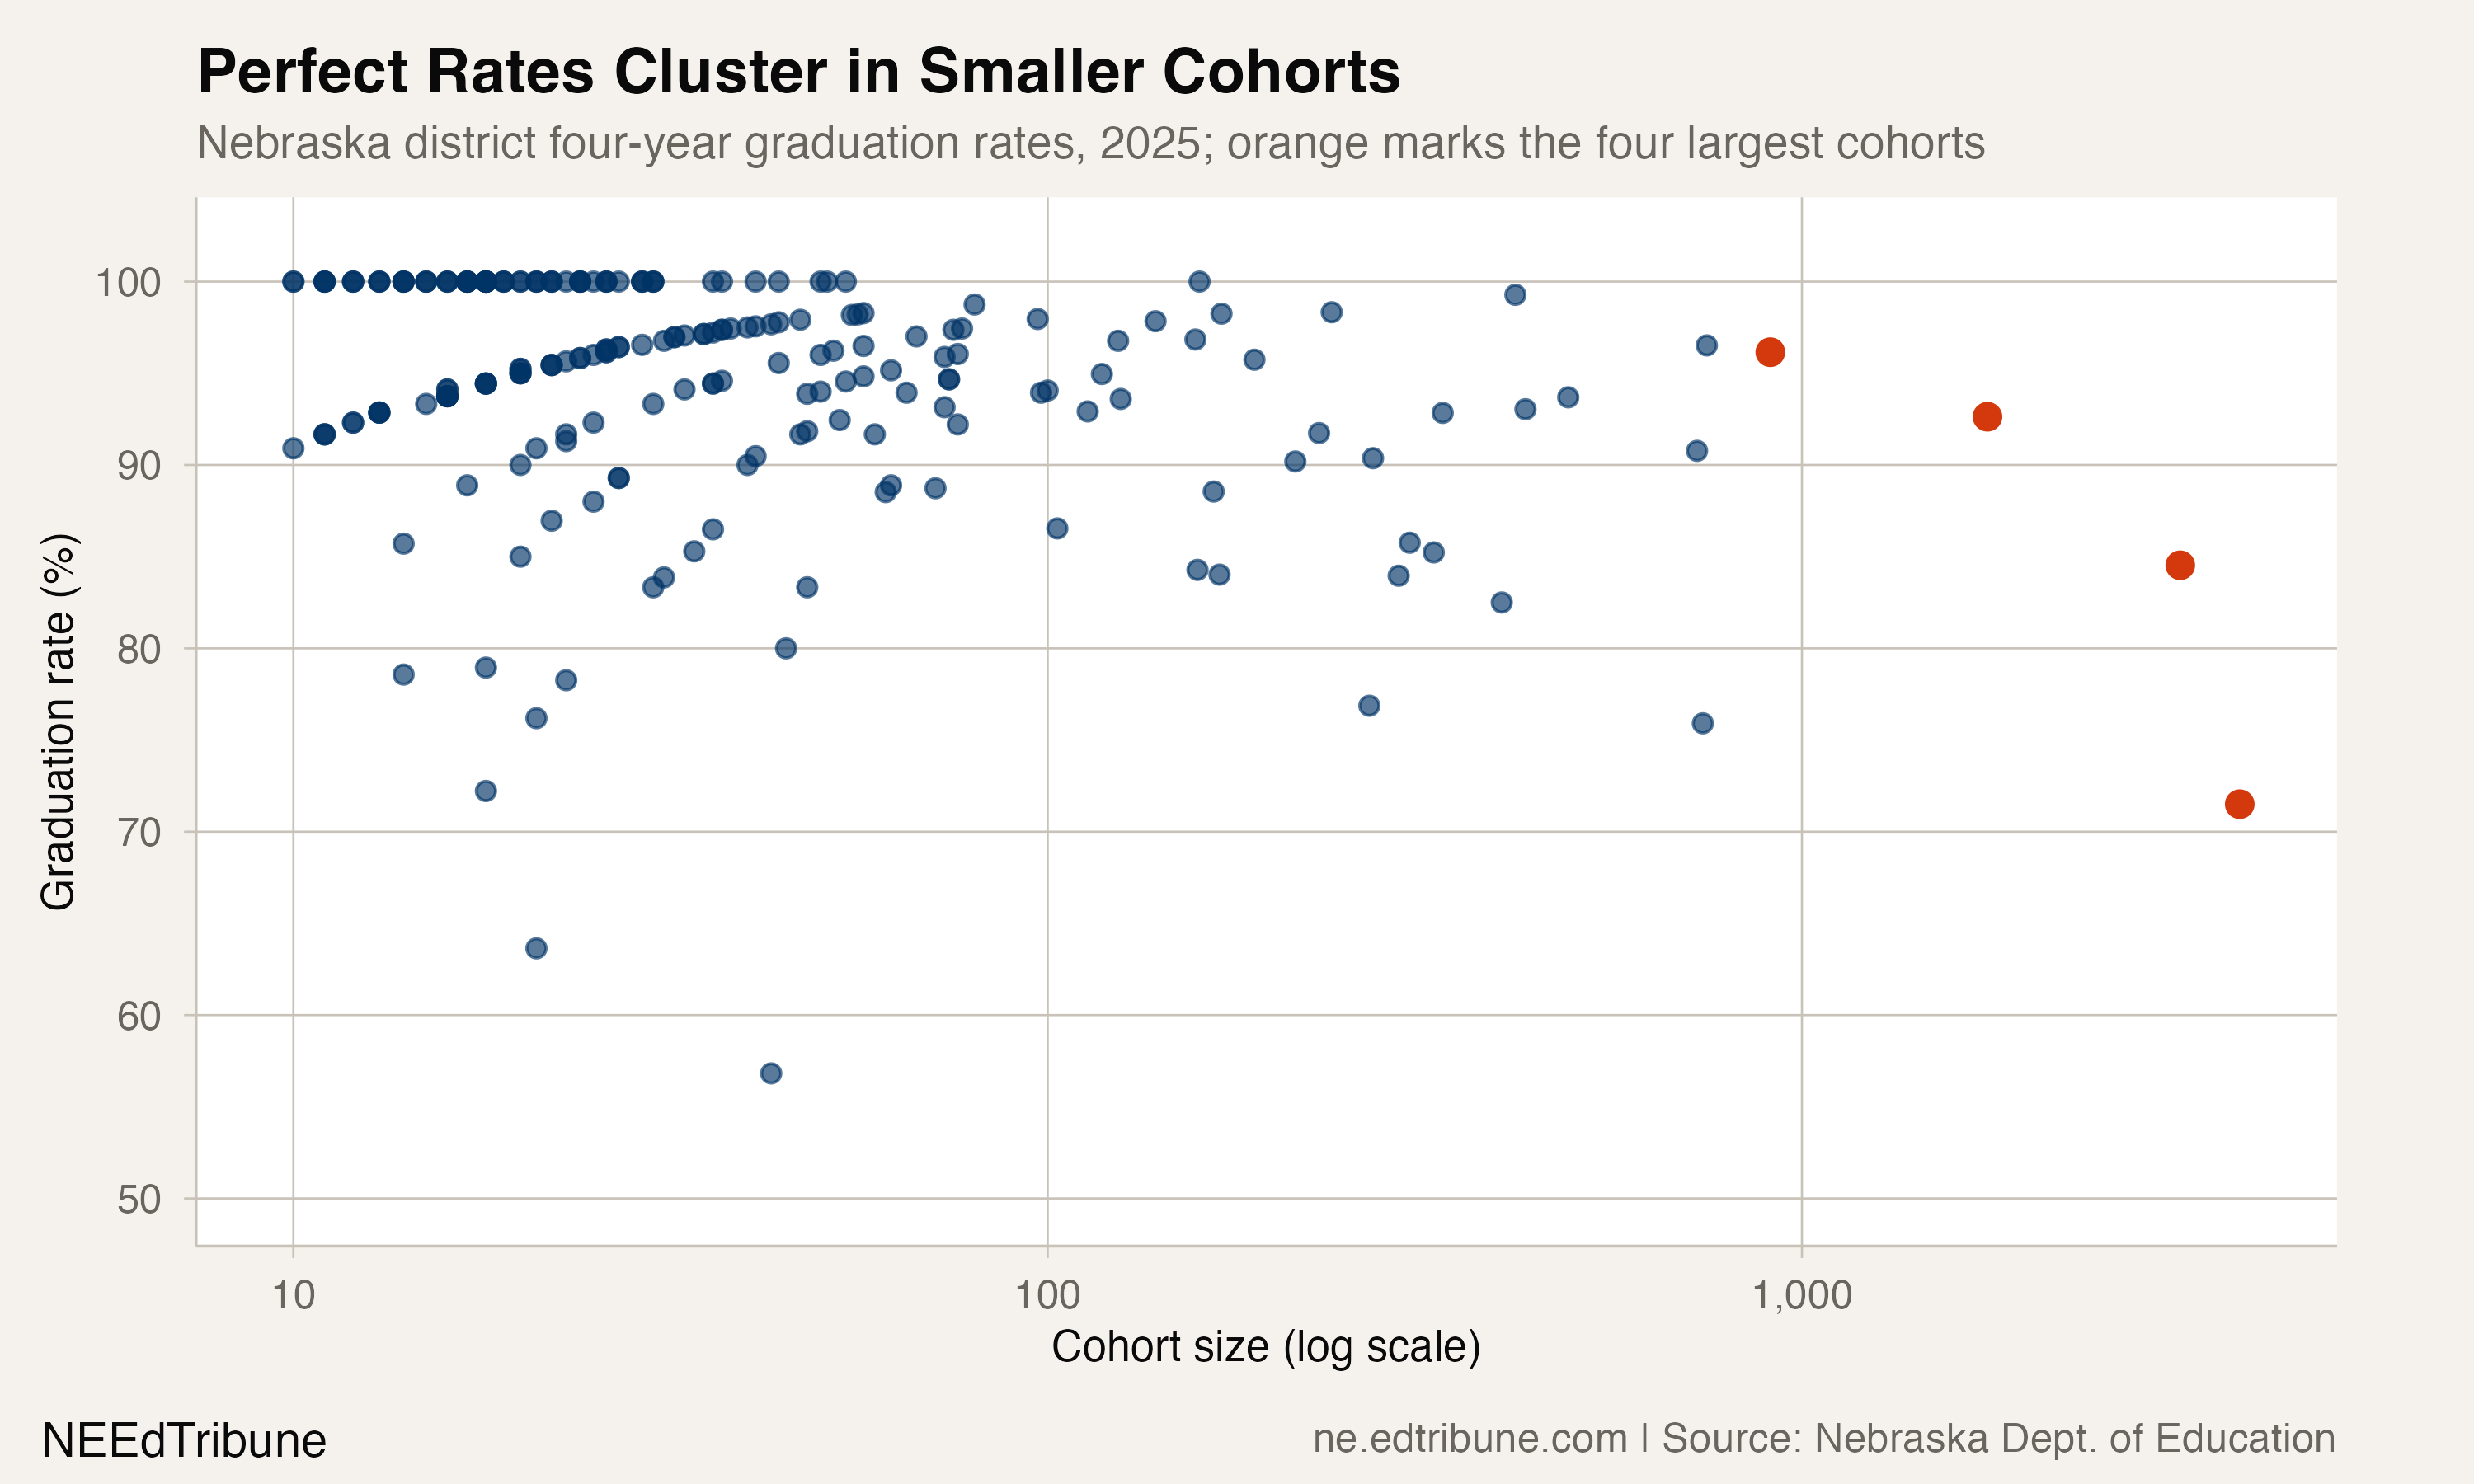
Perfect rates, small denominators
The average cohort among the 70 perfect-rate districts was 23.4 students, and the median was 18.5. Cohorts in that group ranged from 10 to 159 students.
A single additional graduate or non-graduate changes a small cohort's percentage more than a large cohort's. That arithmetic does not make a reported 100% rate false. It means the rate carries less information about how the same district might perform with a much larger cohort.
Four districts reported a 100% rate with cohorts of at least 50: Northwest Public Schools with 159 students, Chadron Public Schools with 54, Malcolm Public Schools with 51, and Milford Public Schools with 50.
Four districts, two-fifths of the cohort
The four largest district cohorts were Omaha Public Schools, Lincoln Public Schools, Millard Public Schools, and Papillion La Vista Community Schools. Together they enrolled 9,650 students — 40.5% of the usable district-row cohort — and posted a student-weighted graduation rate of 82.0%.
Their individual rates and cohort sizes were:
Omaha Public Schools: 71.5% of 3,806 students.
Lincoln Public Schools: 84.5% of 3,174 students.
Millard Public Schools: 92.6% of 1,762 students.
Papillion La Vista Community Schools: 96.2% of 908 students.
The four districts accounted for 1,738 of the 2,800 non-graduates represented in usable district rows, or 62.1%.
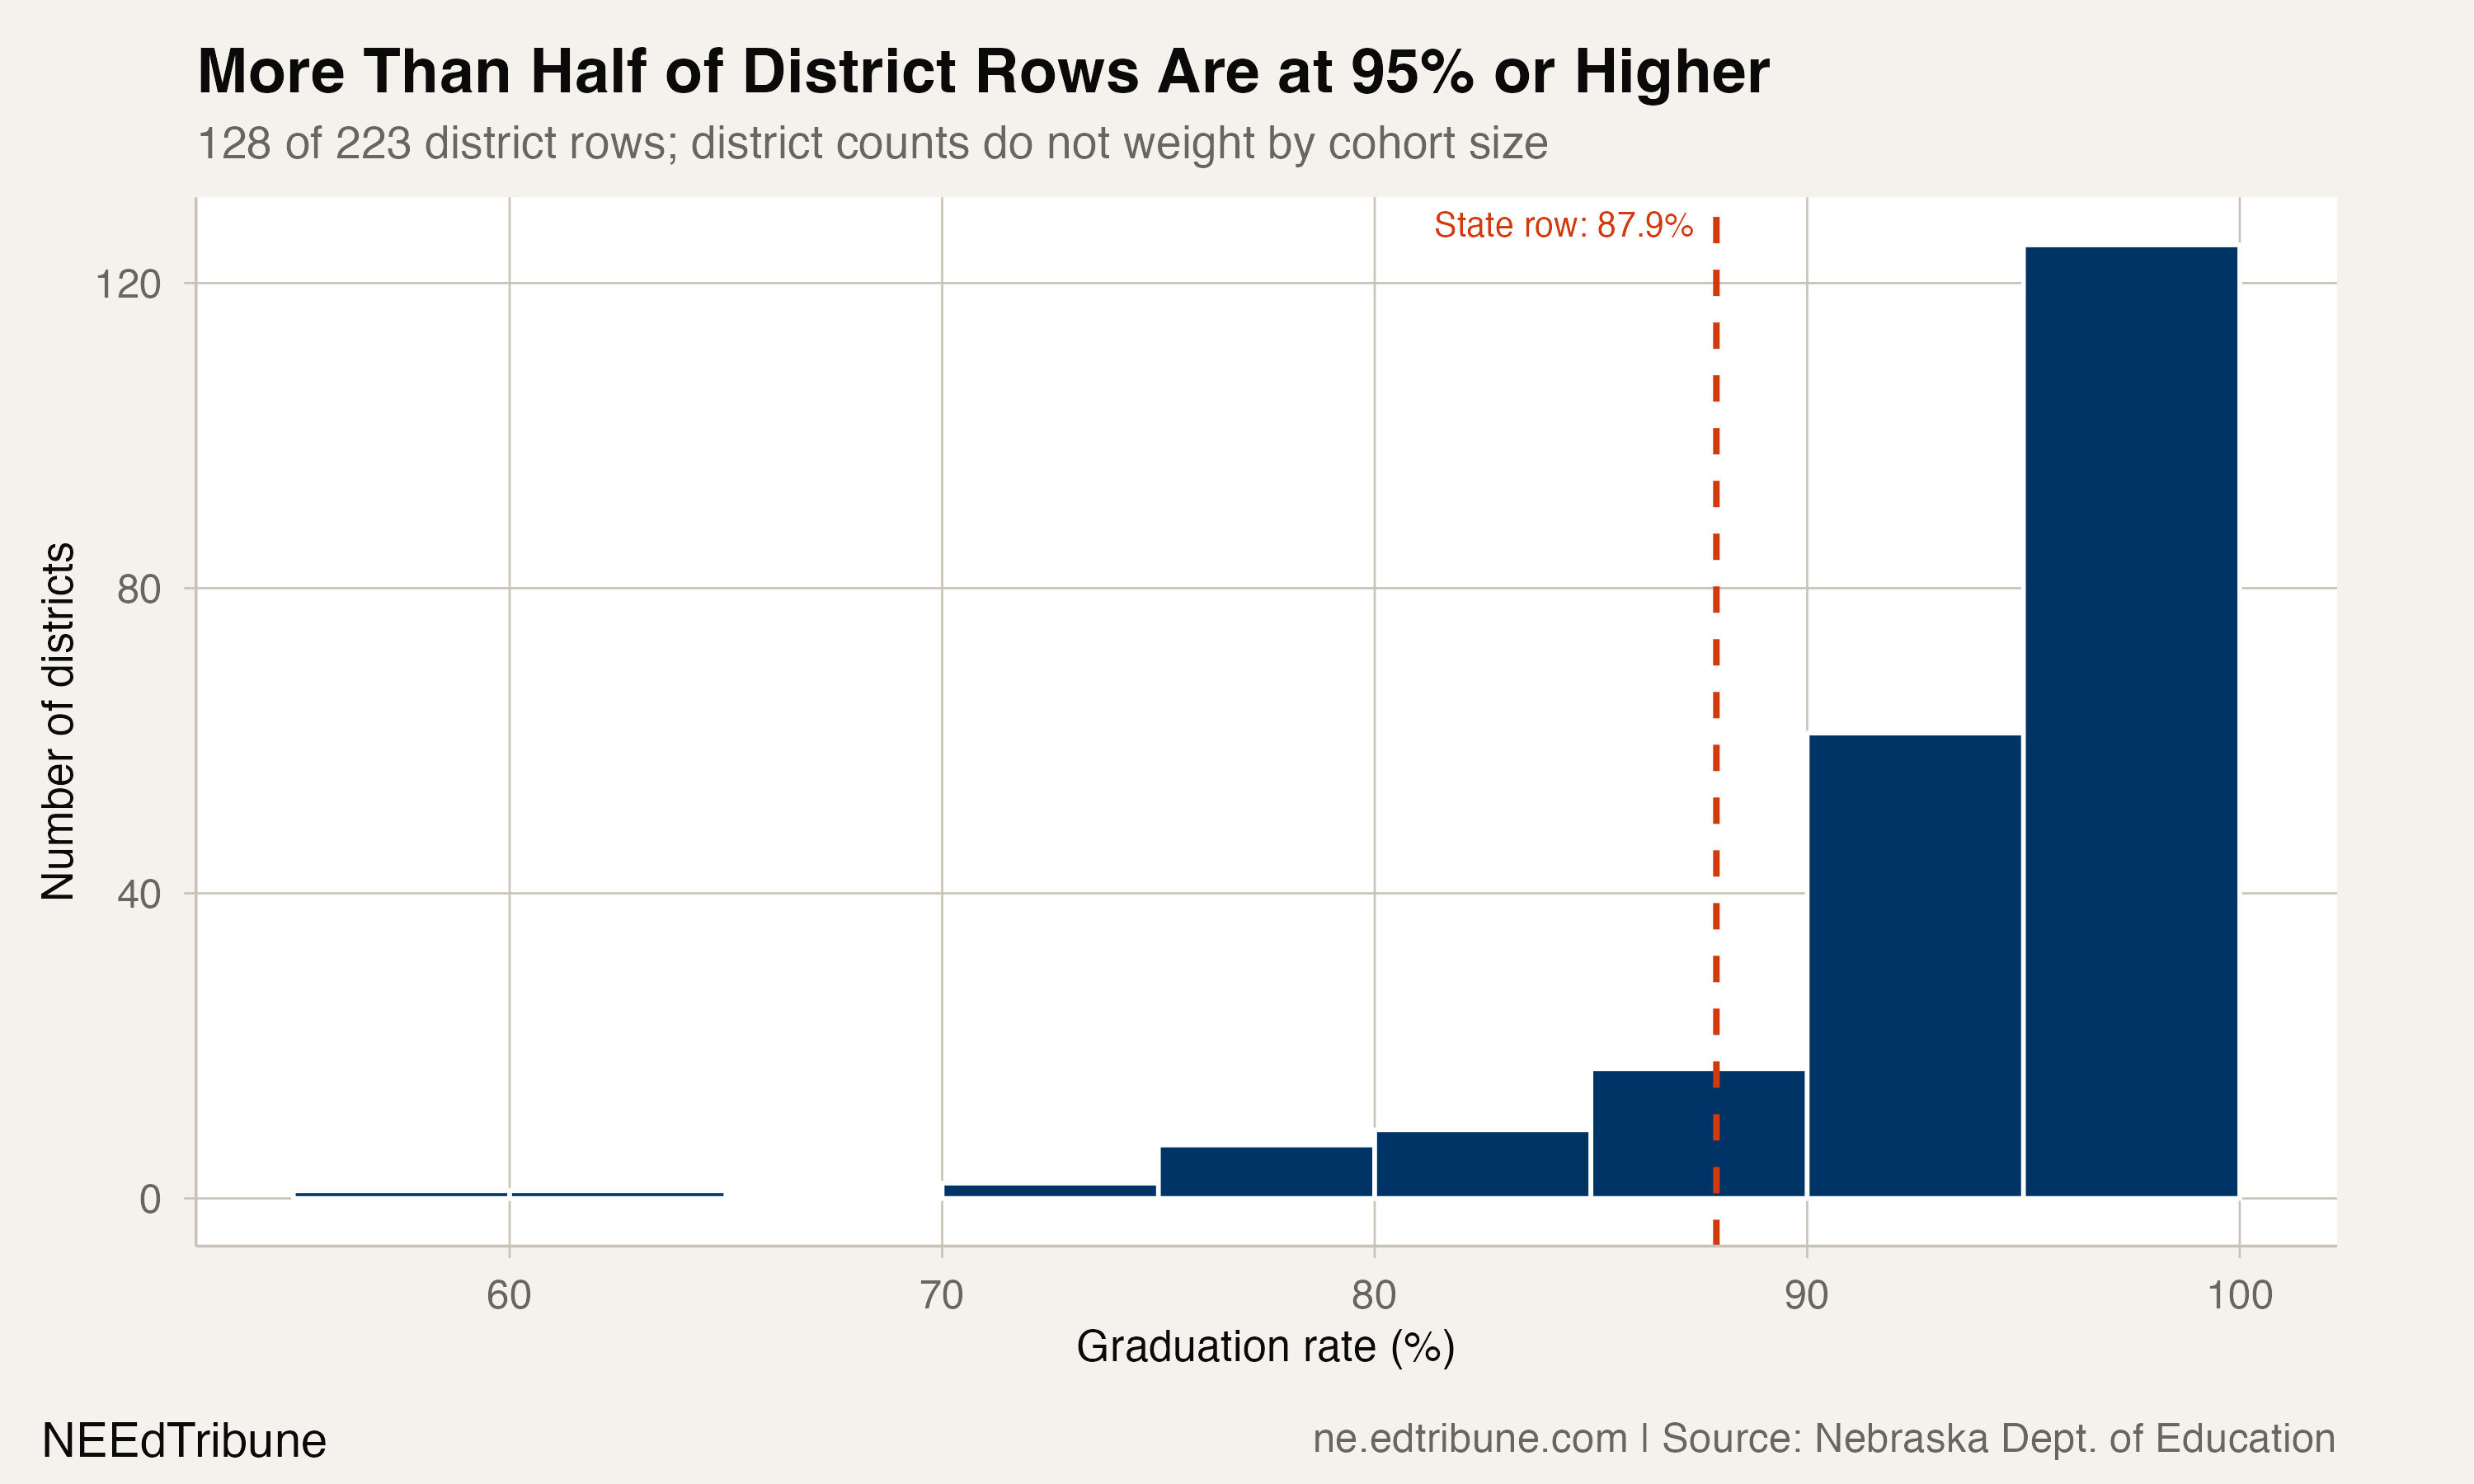
The bottom of the distribution also carries more weight
The district-rate distribution contained 10 rows below 80%, nine from 80% to below 85%, 16 from 85% to below 90%, 60 from 90% to below 95%, and 128 at or above 95%.
The 10 districts below 80% enrolled 4,970 students, or 20.9% of the usable district-row cohort. They accounted for 1,369 non-graduates, or 48.9% of the district-row total.
This concentration follows directly from the denominators: a lower rate applied to a large cohort produces more non-graduates than the same rate applied to a small one.
What the size groups show
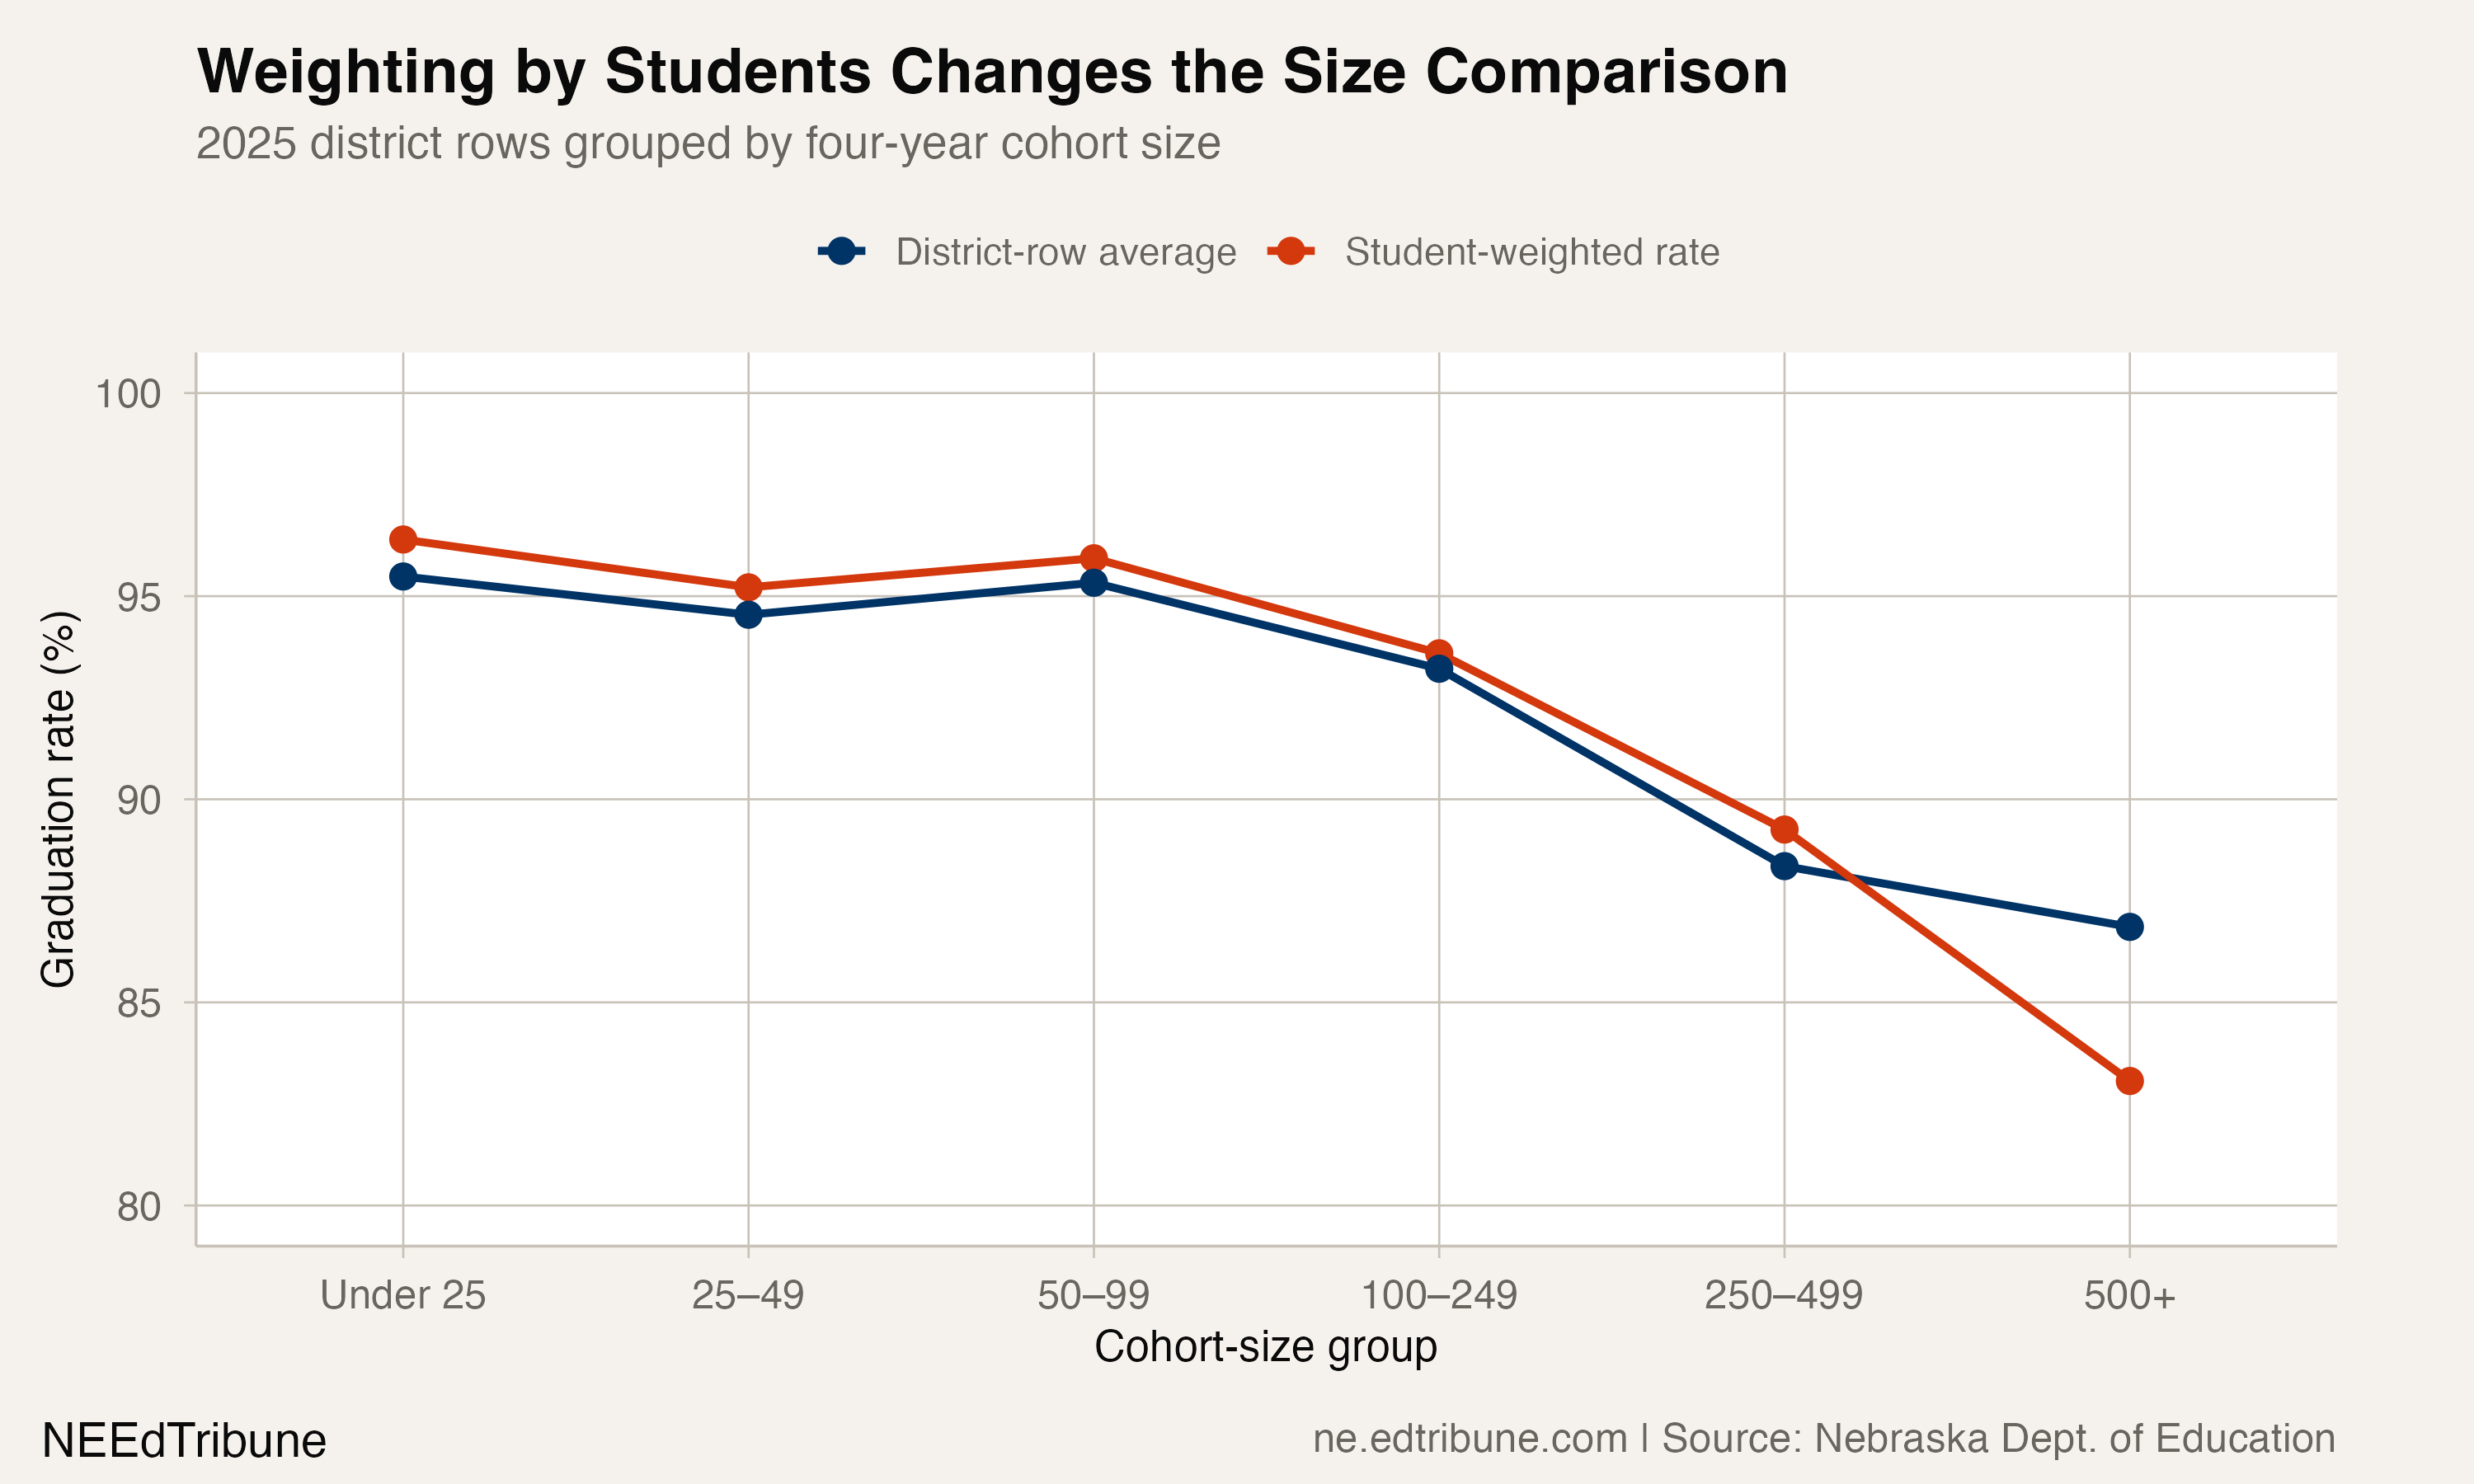
Among the 98 districts with cohorts under 25, the student-weighted rate was 96.4%. Among the seven districts with cohorts of 500 or more, it was 83.1%; those seven rows represented 11,863 students.
Direct evidence: The records establish a graduation-rate gradient across these cohort-size groups and show how the student distribution changes the statewide picture.
Competing explanation: The graduation file alone cannot establish why the groups differ. Student composition, program mix, mobility, reporting practices, and other factors could contribute, but this analysis does not test them.
A coverage caution
Nebraska's official state row reports an 87.9% four-year graduation rate, with 21,243 graduates in a cohort of 24,167. The usable district rows cover 23,816 students and produce a student-weighted rate of 88.2% and an unweighted district average of 94.4%.
Because the state and district-row denominators are not identical, this article preserves the official state rate and labels every district aggregation. The 6.2-point gap between the district-row weighted rate and the unweighted district average is the clearest demonstration of why the chosen unit of analysis matters.
The policy lesson is not that small-district success should be discounted. It is that district counts should not stand in for student counts. Nebraska can truthfully have many districts near 100% while a much smaller set of large districts determines where most non-graduates are found.
Source note: The analysis uses the current four-year graduation records obtained through the Nebraska school-data package from the Nebraska Department of Education data portal. District-row totals exclude records without complete rate, cohort, or graduate counts.
Detailed code that reproduces the analysis and figures in this article is available exclusively to EdTribune subscribers.
Discussion
Sign in to join the discussion.
Loading comments...