Correction (May 29, 2026; updated May 31, 2026): An earlier version of this article misstated several figures because the underlying data pull mixed school-level rows with district-level rows and, in one case, used the statewide Native American rate in place of Winnebago's. We have recomputed every district figure from the district-level graduation records. Among the corrections: Umo N Ho N Nation ranked at the very bottom of the state only from 2021 on (it was third-lowest in 2020, not first), not throughout the record; several years in its rate history were restated (2015, 2016, 2020 and 2024); Winnebago graduated about 86% in 2023 and 84% in 2024 (not 74% and 71%); Winnebago's 2025 cohort was 45 students; the Native American statewide gap is the fifth-widest among student groups, not the third; and a claim that Winnebago was consistently 10 to 30 points ahead of Umo N Ho N Nation has been corrected to reflect that Winnebago led in 13 of 14 years, often by 20 to 40 points, and that in 2022 Umo N Ho N Nation briefly outperformed Winnebago. EdTribune regrets the errors.
Umo N Ho N Nation Public Schools, the school system of the Omaha Tribe in Thurston County, graduated about 57% of its 43-student cohort in 2025. That was the lowest four-year graduation rate of any district in Nebraska this year. But the longer record is more complicated than a single low number suggests. The district has ranked at the very bottom of the state only since 2021. In the years before that it placed well off the floor, ranking 68th-lowest in 2012 and around the lower-middle of Nebraska's public school districts through 2019, and as recently as 2022 it graduated more than 87% of its seniors on time.
Nearby Winnebago Public Schools, serving students of the Winnebago Tribe, graduated 80% of its 45-student cohort in 2025, after a run of years above 80%. Statewide, students who are Native American graduated at about 74% in 2025, roughly 20 points behind the white rate of nearly 94%.
What the tribal data shows most clearly is not a steady gap but volatility. In cohorts this small, a handful of students can move a district's rate by 10 or 20 points in a single year. The story at Umo N Ho N Nation is less a slow decline than a series of sharp swings, including some of the strongest single-year results in the state.
A seismograph, not a trend line
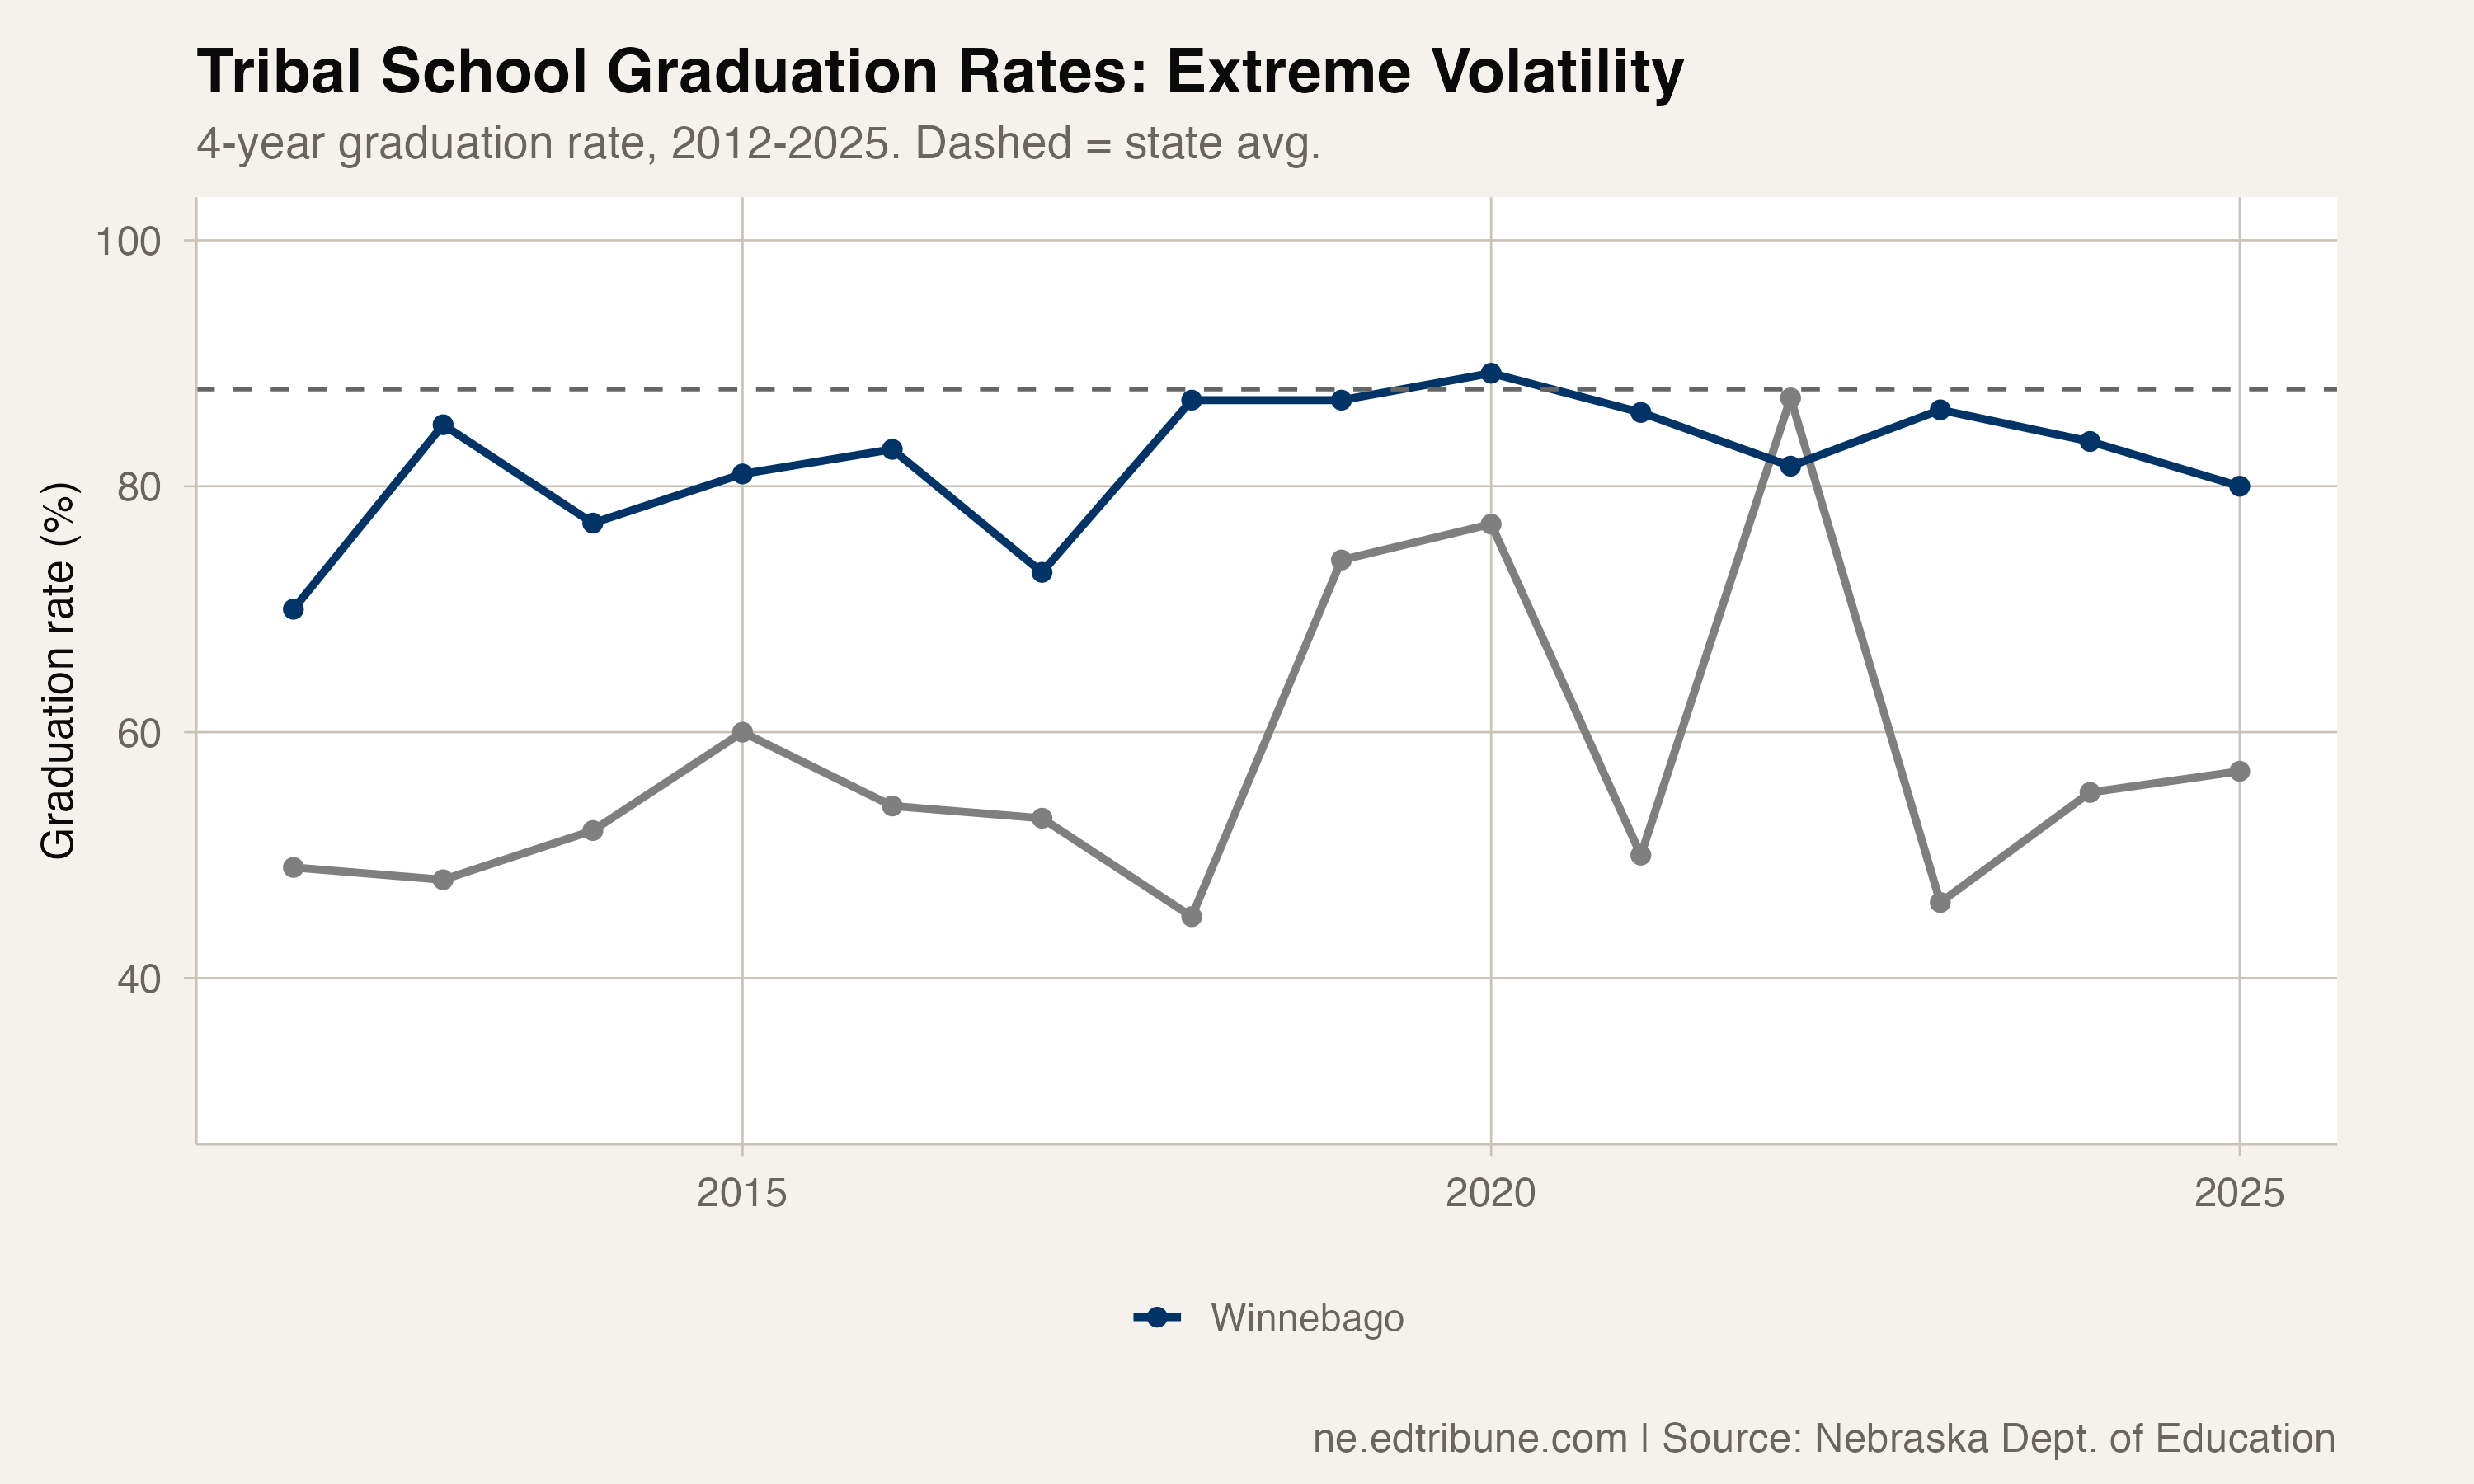
Umo N Ho N Nation's graduation rate chart looks unlike any other district's. In 2015 the rate was 60%. It moved to 54% in 2016, 53% in 2017, and 45% in 2018, then climbed sharply to 74% in 2019 and nearly 77% in 2020. After dropping to 50% in 2021, the district posted its best year on record at 87.2% in 2022, fell to 46% in 2023, and has since landed at about 55% in 2024 and 57% in 2025.
This is not a trend line. It is a seismograph. With a cohort that has ranged from 20 to 49 students, 5 additional graduates can swing the rate by 10 to 15 percentage points. The 2022 result, the district's best, represented a cohort where 34 of 38 students completed on time. The following year's drop to 46% reflected a different cohort with different outcomes, not necessarily a different school.
Winnebago's path has been steadier and stronger. The district ranged from 73% to 89% between 2015 and 2022, with most years in the 80s, then held at about 86% in 2023 and 84% in 2024 before settling at 80% in 2025. With cohorts in the same size class as Umo N Ho N Nation, Winnebago faces the same statistical volatility, yet its students have graduated at consistently higher rates.
The statewide picture
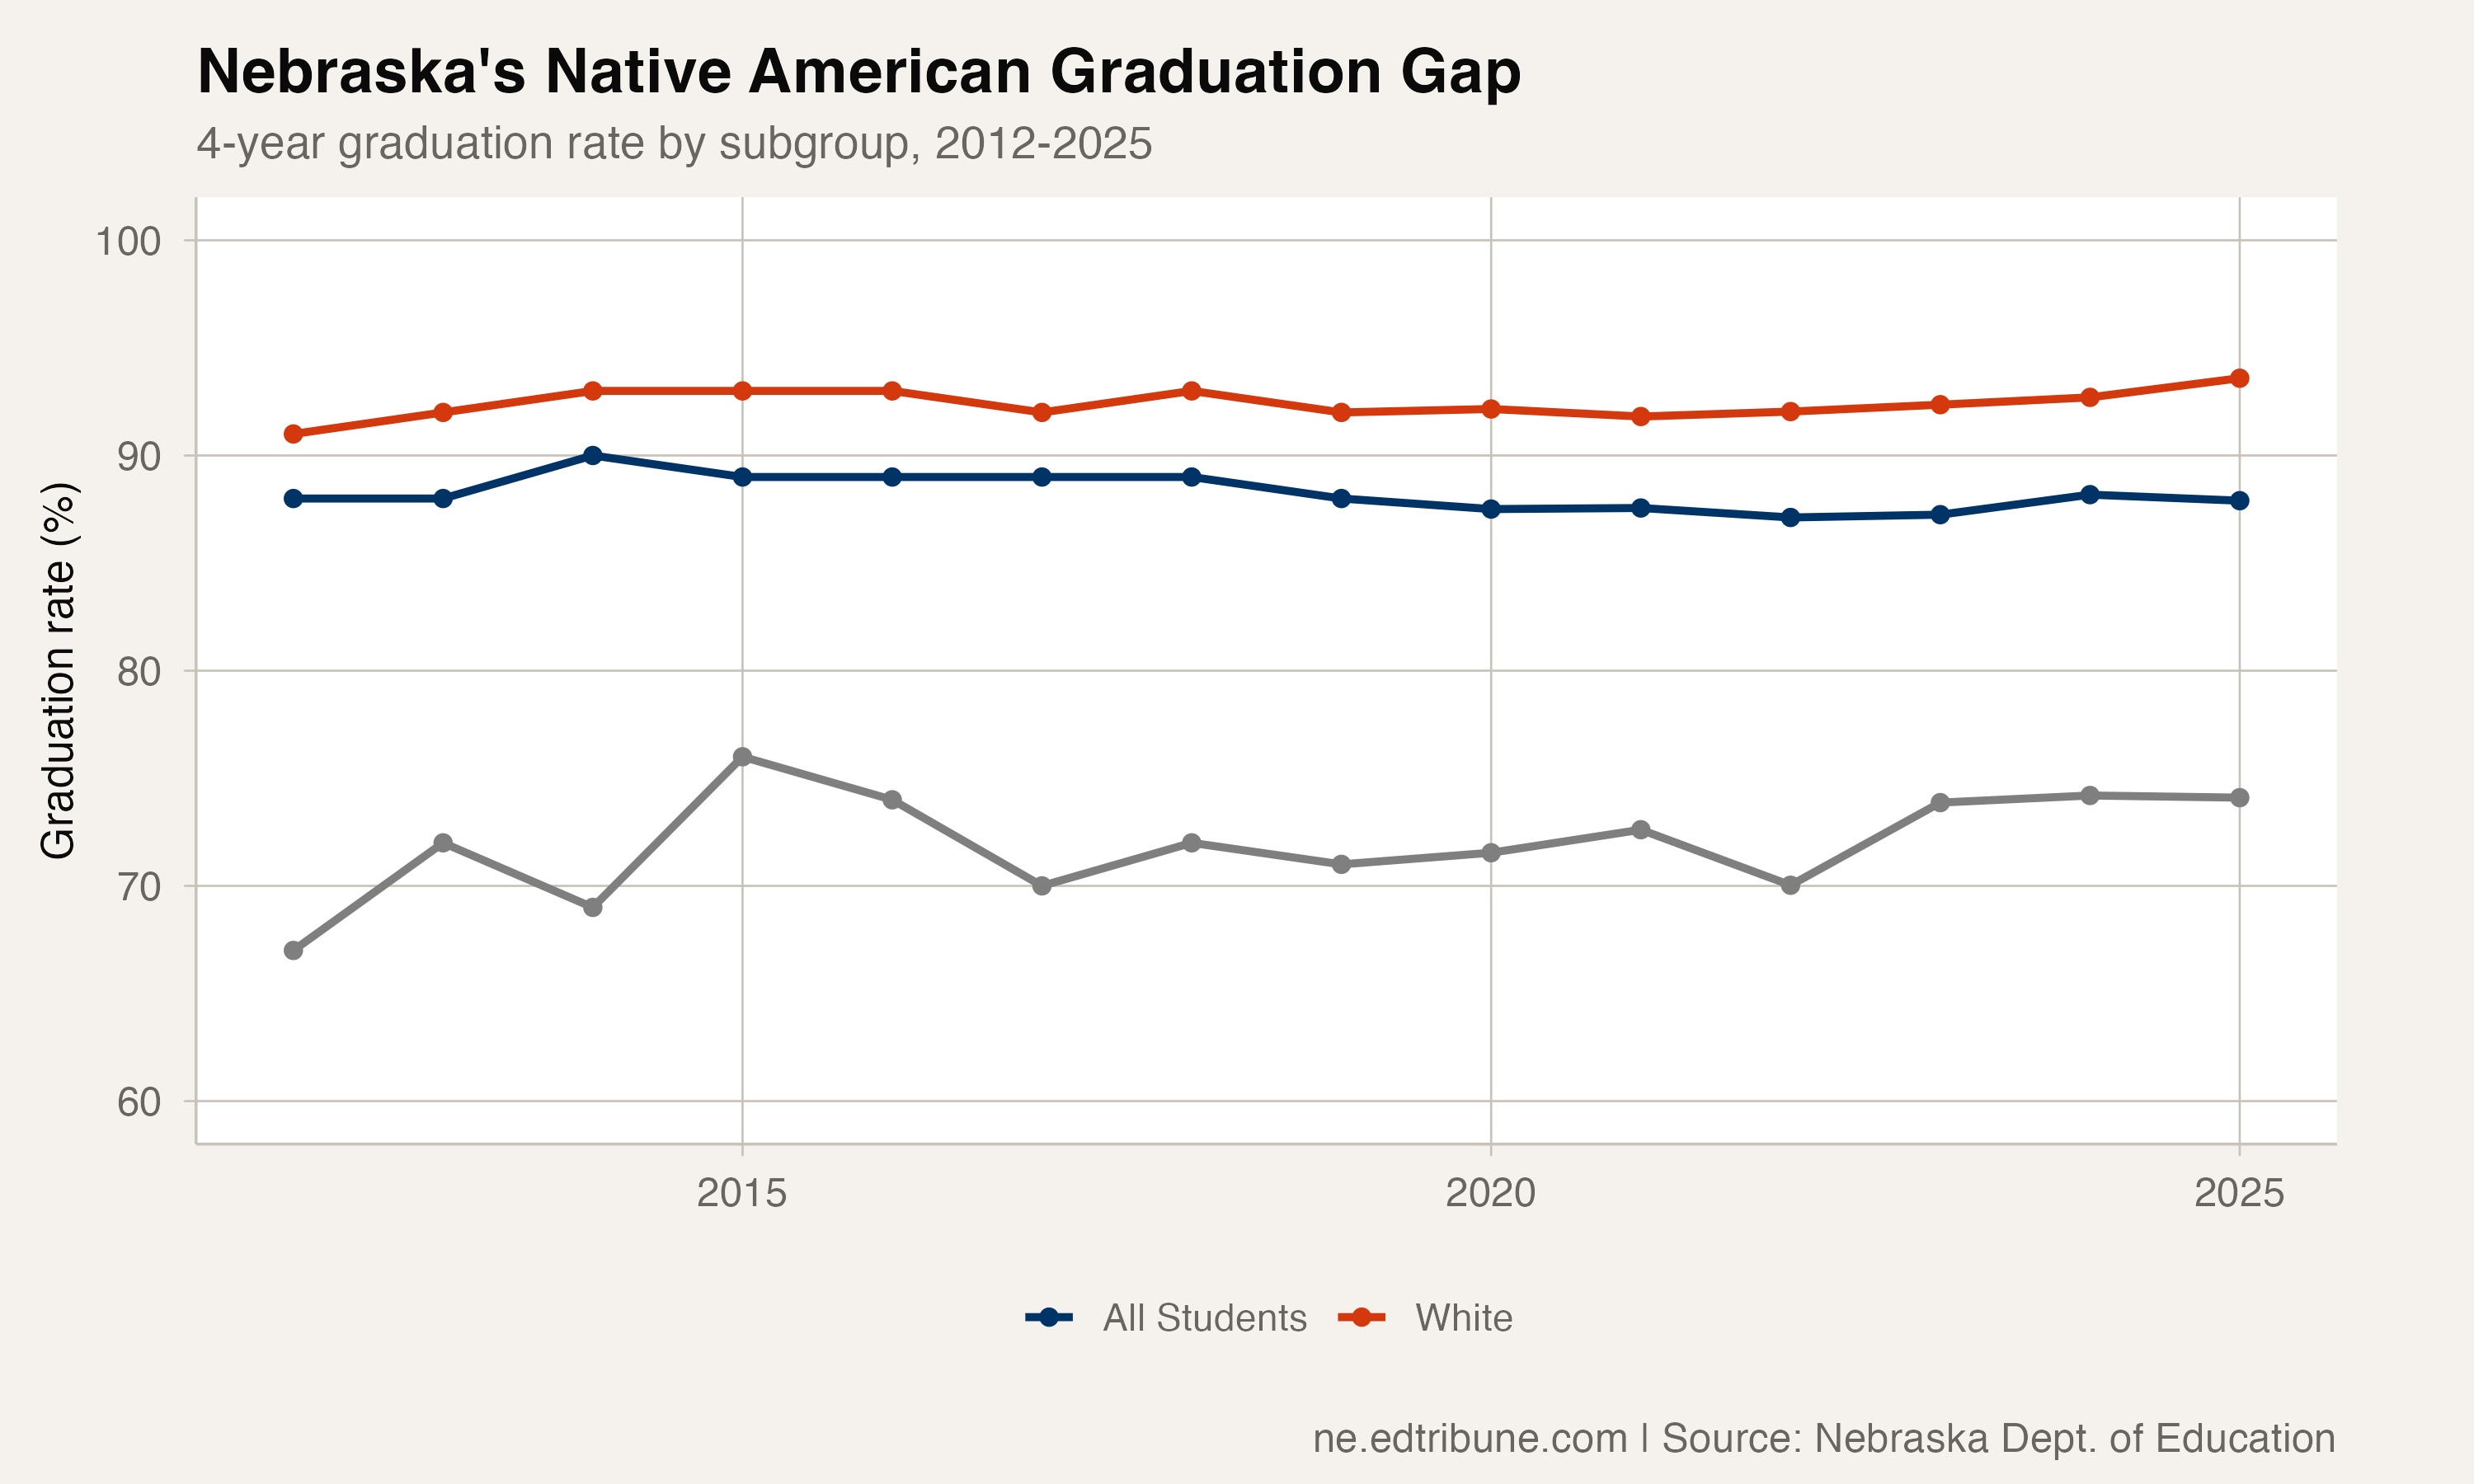
Across the state, the rate for students who are Native American has been steadier than at any single tribal district, reflecting a larger cohort of 304 students spread across many schools. The rate has improved from 67% in 2012 to about 74% in 2025, a gain of roughly 7 percentage points.
That improvement has been uneven. The rate reached 76% in 2015, eased to 70% in 2017, recovered to nearly 73% in 2021, and has held in the 74% range for the past three years. The recent gains are real but the trajectory has flattened.
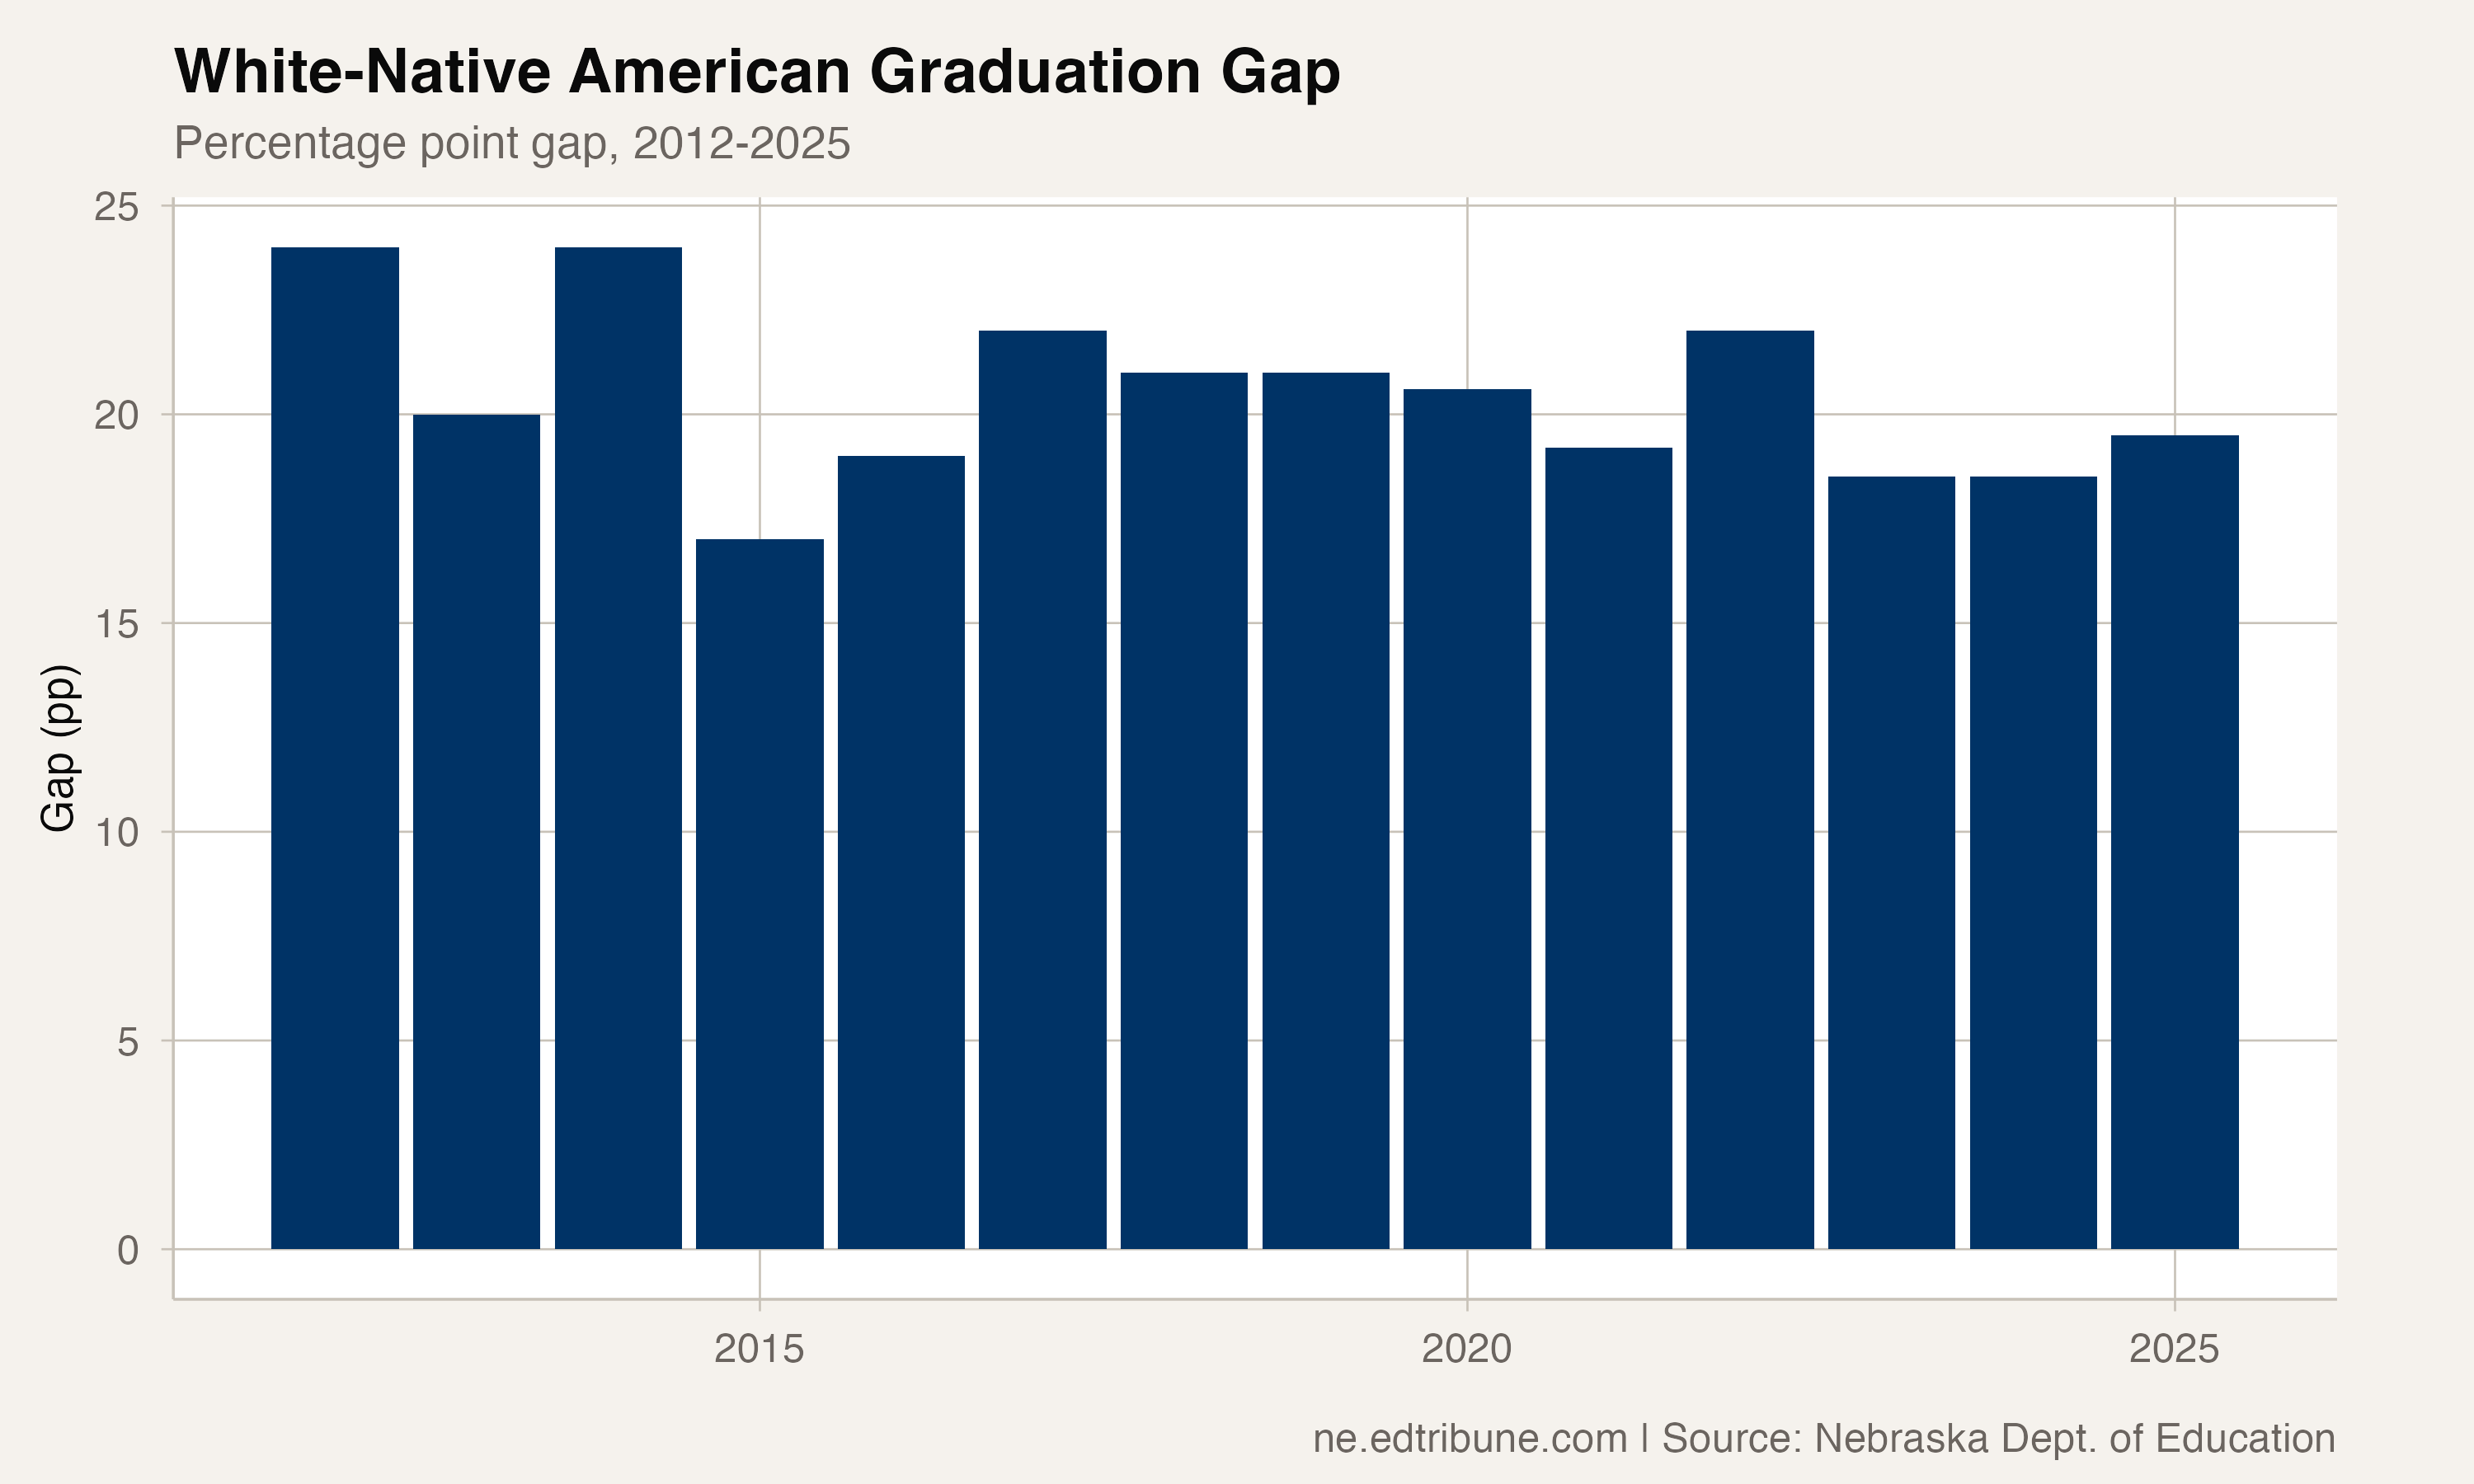
The gap between white students and students who are Native American has narrowed, from 24 points in 2012 to about 20 points in 2025. It is one of several sizable gaps in Nebraska's graduation data. Larger gaps to the white rate appear for students who are learning English (about 41 points), students in foster care (about 38 points), students who are currently homeless (about 31 points), and students who receive special education services (about 24 points). The Native American gap of roughly 20 points sits below those four, which makes the steady progress at the statewide level the more useful signal: the gap is closing, slowly, even as four other groups face wider distances to cover.
Two tribal schools, different outcomes
The contrast between Umo N Ho N Nation and Winnebago, both tribal school districts in Thurston County, geographically adjacent, serving similar populations, is difficult to explain from the graduation data alone.
Winnebago has graduated more than 70% of its students in every one of the 14 years on record. Its cohorts have ranged from 32 to 57 students, in the same size class as Umo N Ho N Nation's range of 20 to 49. Yet Winnebago's rate has been higher in 13 of the 14 years on record, often by 20 to 40 points, a difference that small-cohort volatility alone does not explain. The one exception was 2022, when Umo N Ho N Nation posted its best year and edged ahead by about 6 points.
Santee Community Schools, serving the Santee Sioux Nation in Knox County, offers little to compare against. Its graduation data is suppressed in nearly every year because the cohorts are so small, with only a single recent year reported (about 92% in a cohort of 11). That suppression is itself a feature of measuring tribal schools, where cohorts are often too small to report a rate at all.
What the four-year rate misses
The four-year graduation rate is a narrow lens for measuring outcomes at tribal schools. Students in tribal communities face compounding factors (high poverty, limited local employment, housing instability, intergenerational trauma) that can delay but not necessarily prevent graduation.
The 2022 result at Umo N Ho N Nation, when 34 of 38 students graduated on time for an 87.2% rate, shows the capacity is there. The question is whether that year was the outlier or whether the years on either side, 50% in 2021 and 46% in 2023, are the outliers. With cohorts under 50, the data cannot answer that question definitively.
A five-year extended rate, which Nebraska does not publish, would almost certainly show higher graduation rates for tribal schools. Students who take an additional year may be succeeding on a timeline that the four-year measure does not capture.
The 304-student cohort
Statewide, 304 students who are Native American were in the 2025 graduation cohort. At about 74%, roughly 78 did not graduate on time. This is a small number in absolute terms, smaller than a single cohort at most suburban districts.
The gap to white students, now about 20 points, has been narrowing across 14 years of data even as it persists. For the students it touches it is no less real for being small in aggregate, and the steady statewide gains suggest the closing can continue with sustained attention.
Detailed code that reproduces the analysis and figures in this article is available exclusively to EdTribune subscribers.
Discussion
Sign in to join the discussion.
Loading comments...