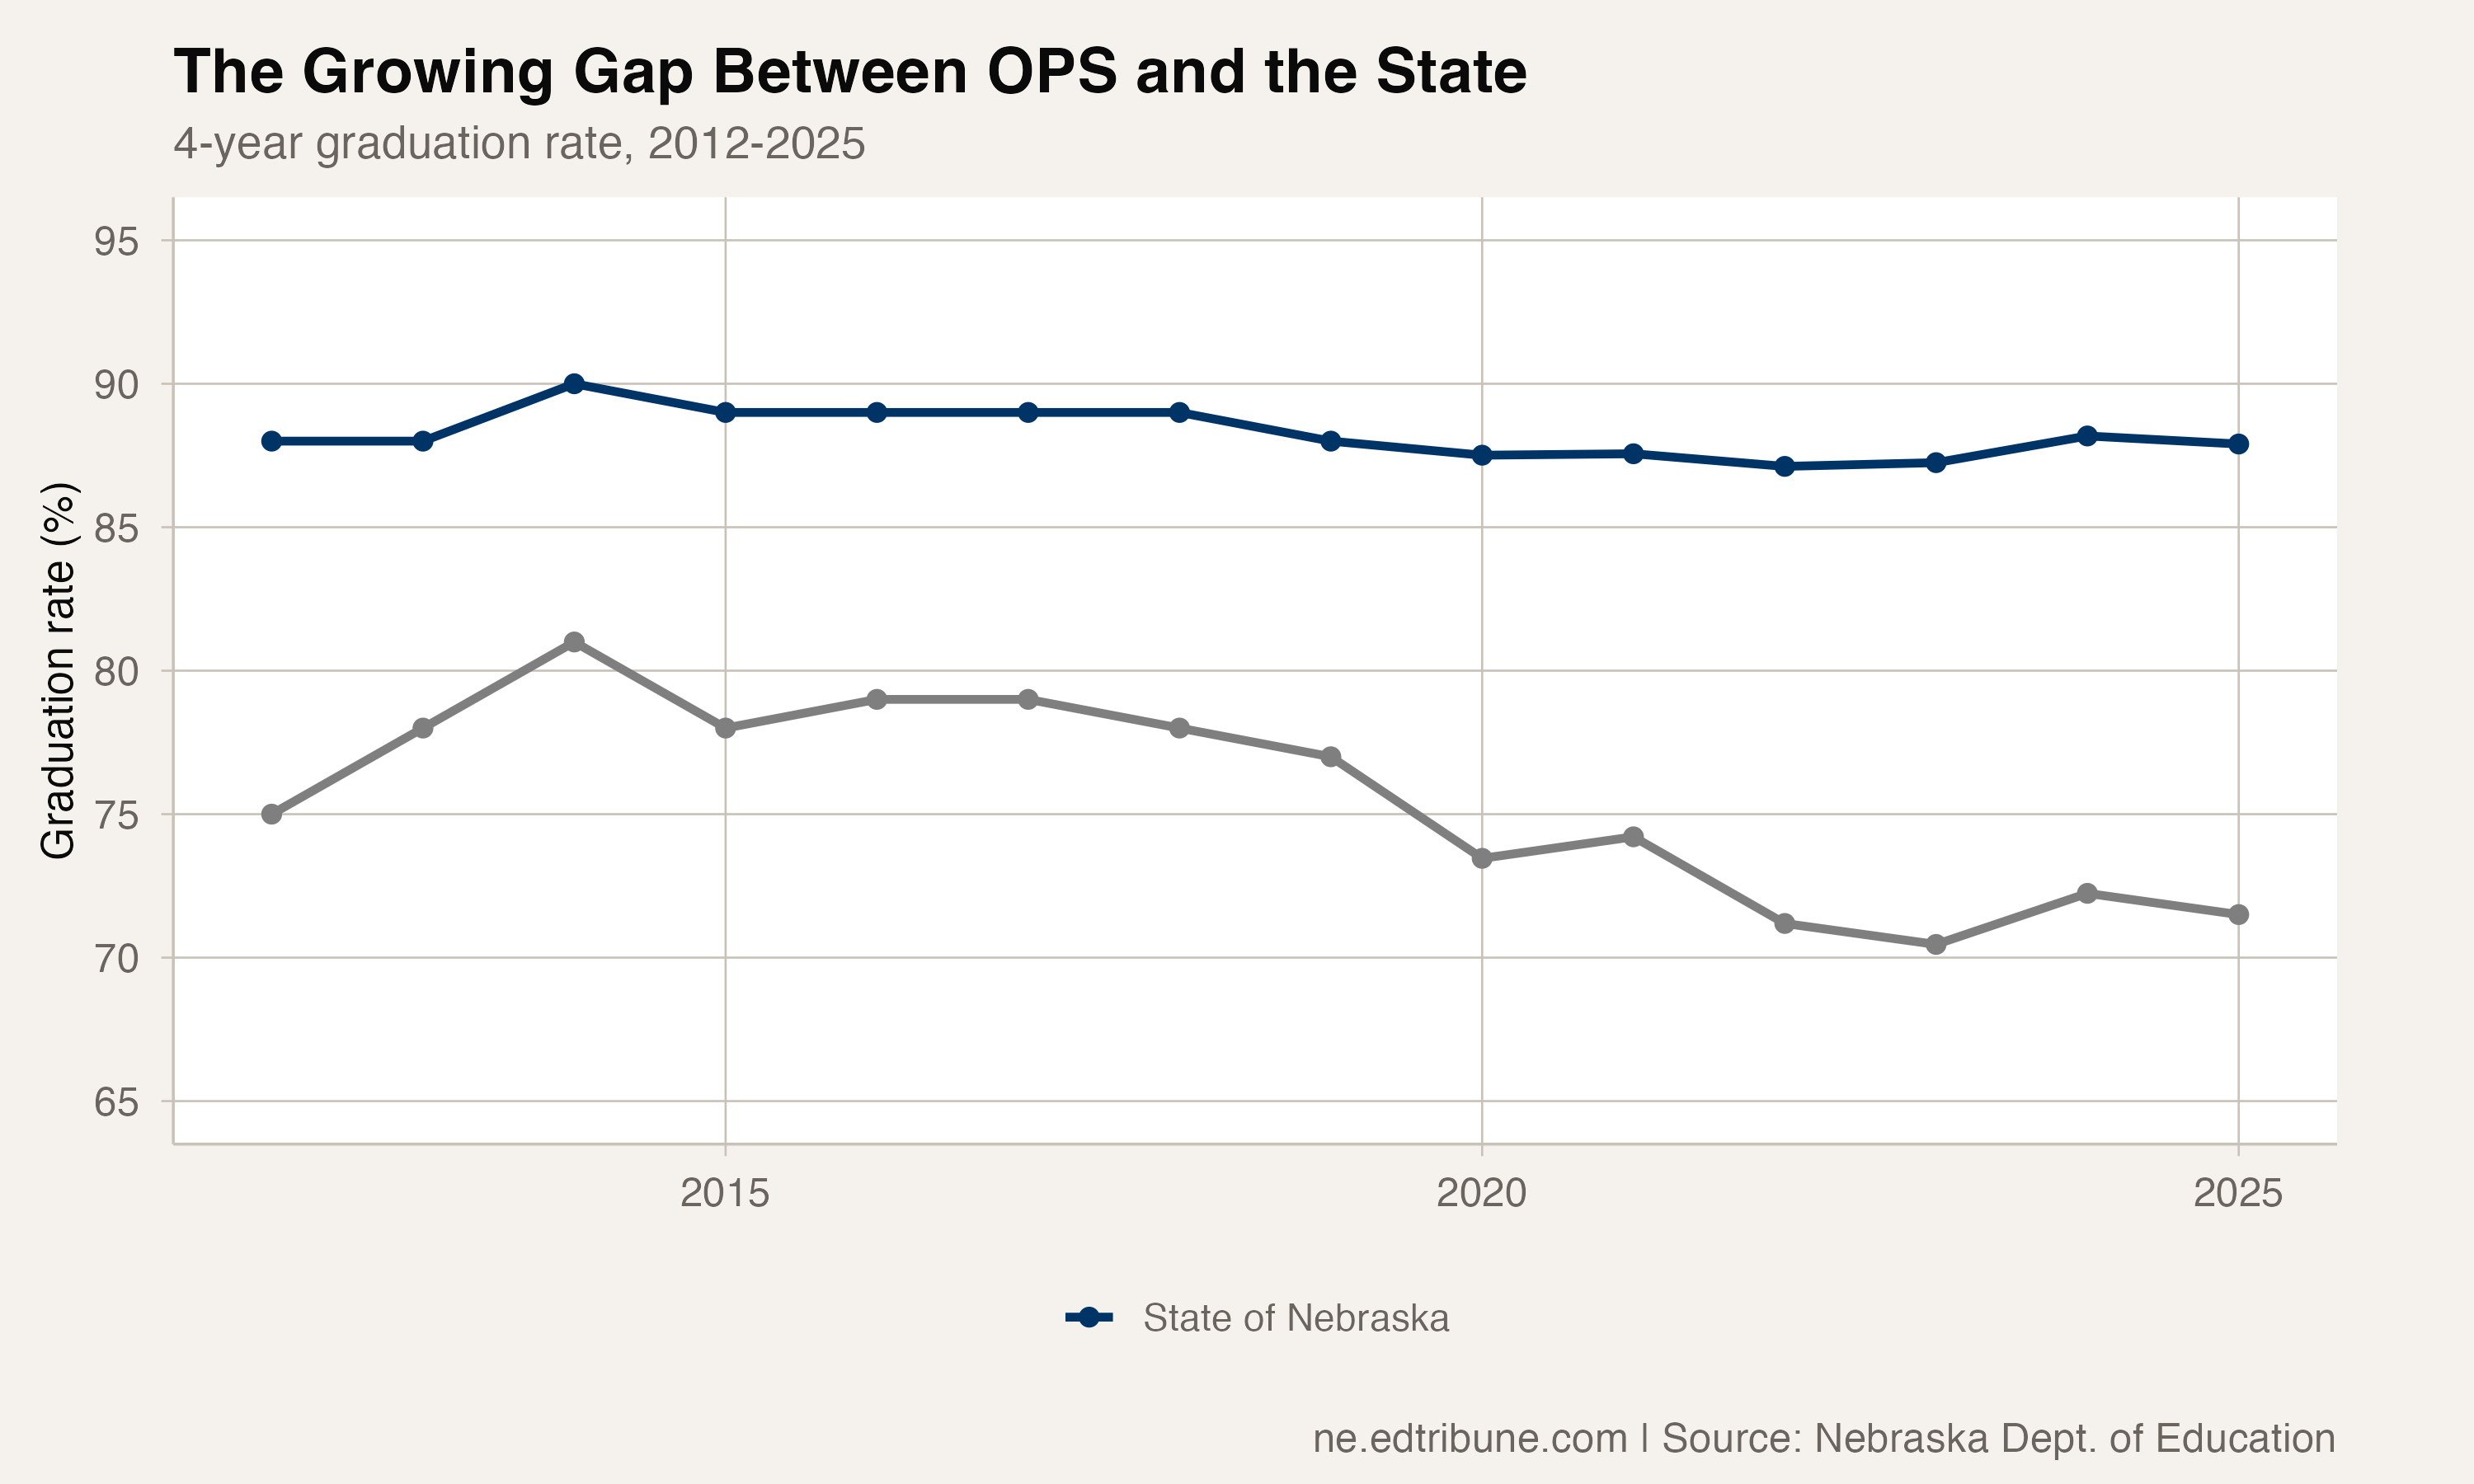
Omaha Public Schools peaked at an 81% graduation rate in 2014. It has not come close since.
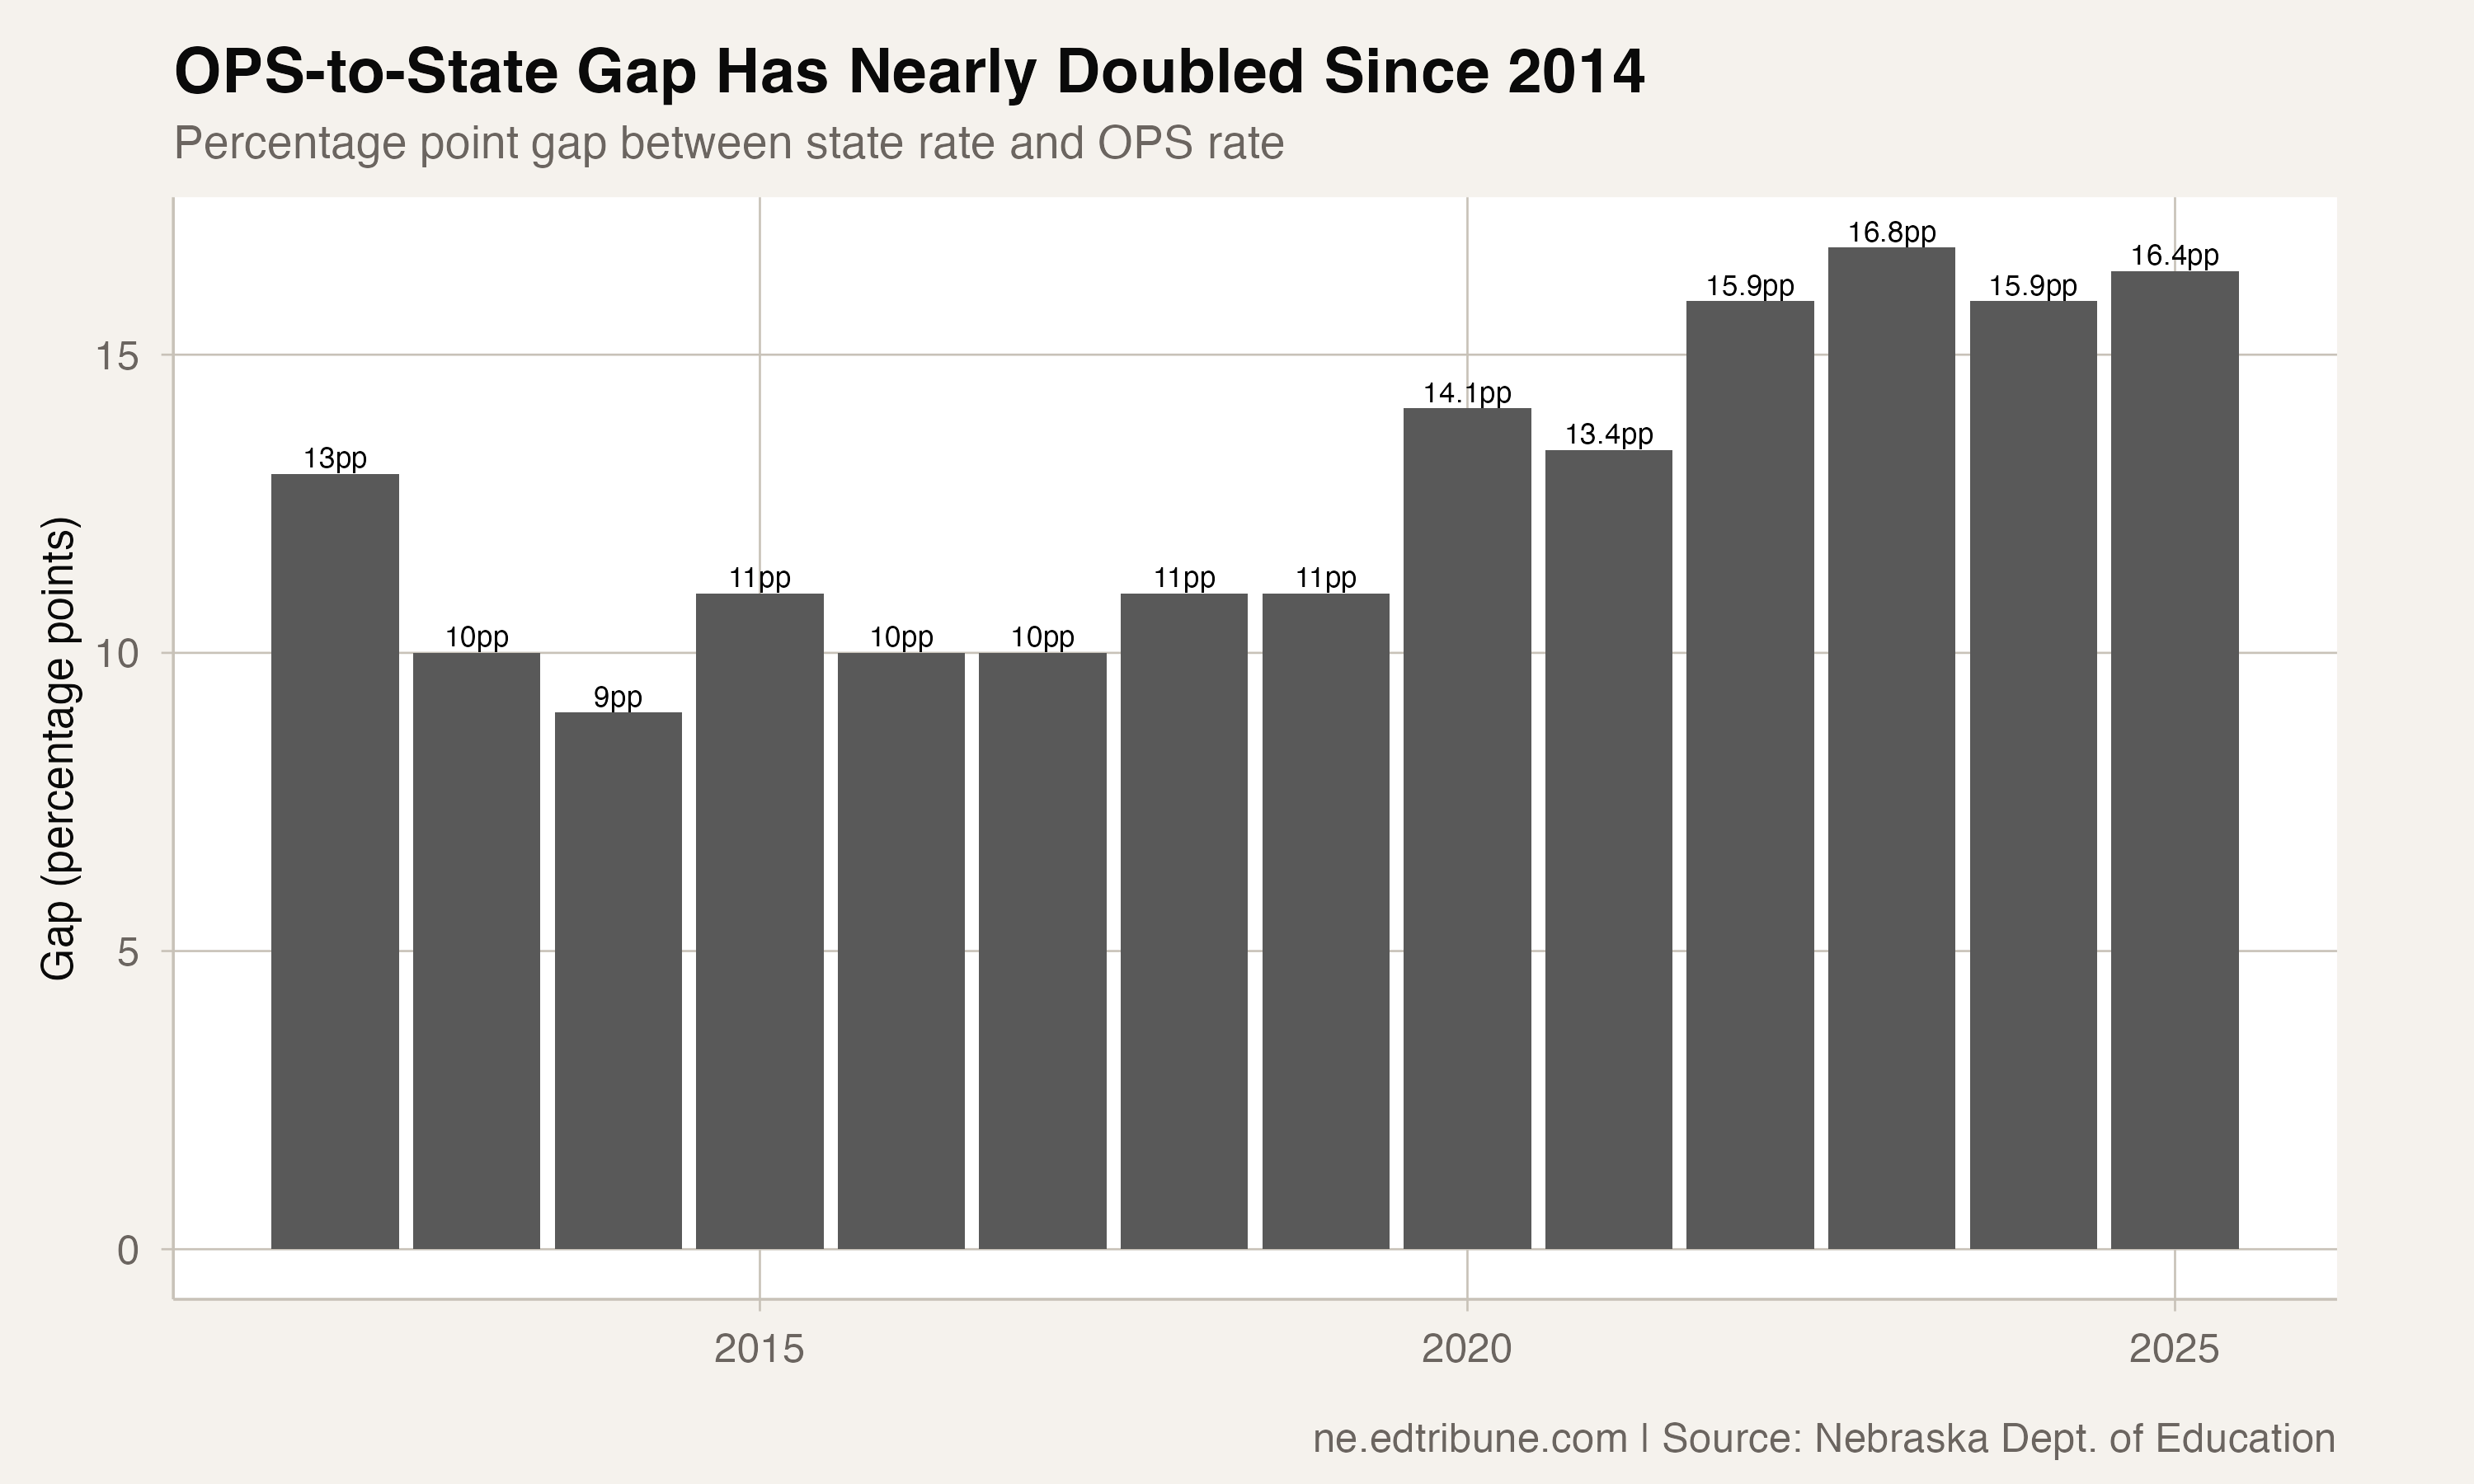
The state's largest district graduated 71.5% of its 3,806-member cohort in 2025, posting the second-widest gap to the state average in the 14 years Nebraska has tracked four-year graduation rates. The state finished at 87.9%. The 16.4 percentage point spread between OPS and the rest of the state has nearly doubled from 9 points at the 2014 peak, and it is now wider than any gap OPS recorded in the 2012-2019 period.
In raw numbers, 1,085 OPS students did not earn a diploma within four years. That is more non-graduates than the entire senior classes of most Nebraska districts.
A district moving in the wrong direction
The trajectory since 2014 has been stubbornly downward. OPS hit 81% that year when the state rate was 90%, producing a 9-point gap. Then the slide began: 78% in 2015, 79% in 2016, 78% in 2018, 77% in 2019. COVID accelerated the decline to 73.5% in 2020 and 74.2% in 2021. Post-COVID, instead of recovering, OPS fell further — 71.2% in 2022, 70.5% in 2023.
A modest rebound to 72.2% in 2024 gave way to 71.5% in 2025. In the last six years, OPS has not once touched 75%.
Meanwhile, the state's other large districts are operating in a different reality. Millard Public Schools graduated 92.6% of 1,762 students. Papillion-La Vista Community Schools posted 96.2% with 908 students. Elkhorn Public Schools finished at 96.5% with 748 students. Even Lincoln Public Schools, which serves a demographically comparable population, graduated 84.5% of its 3,174-student cohort — 13 points above OPS.
Who falls through
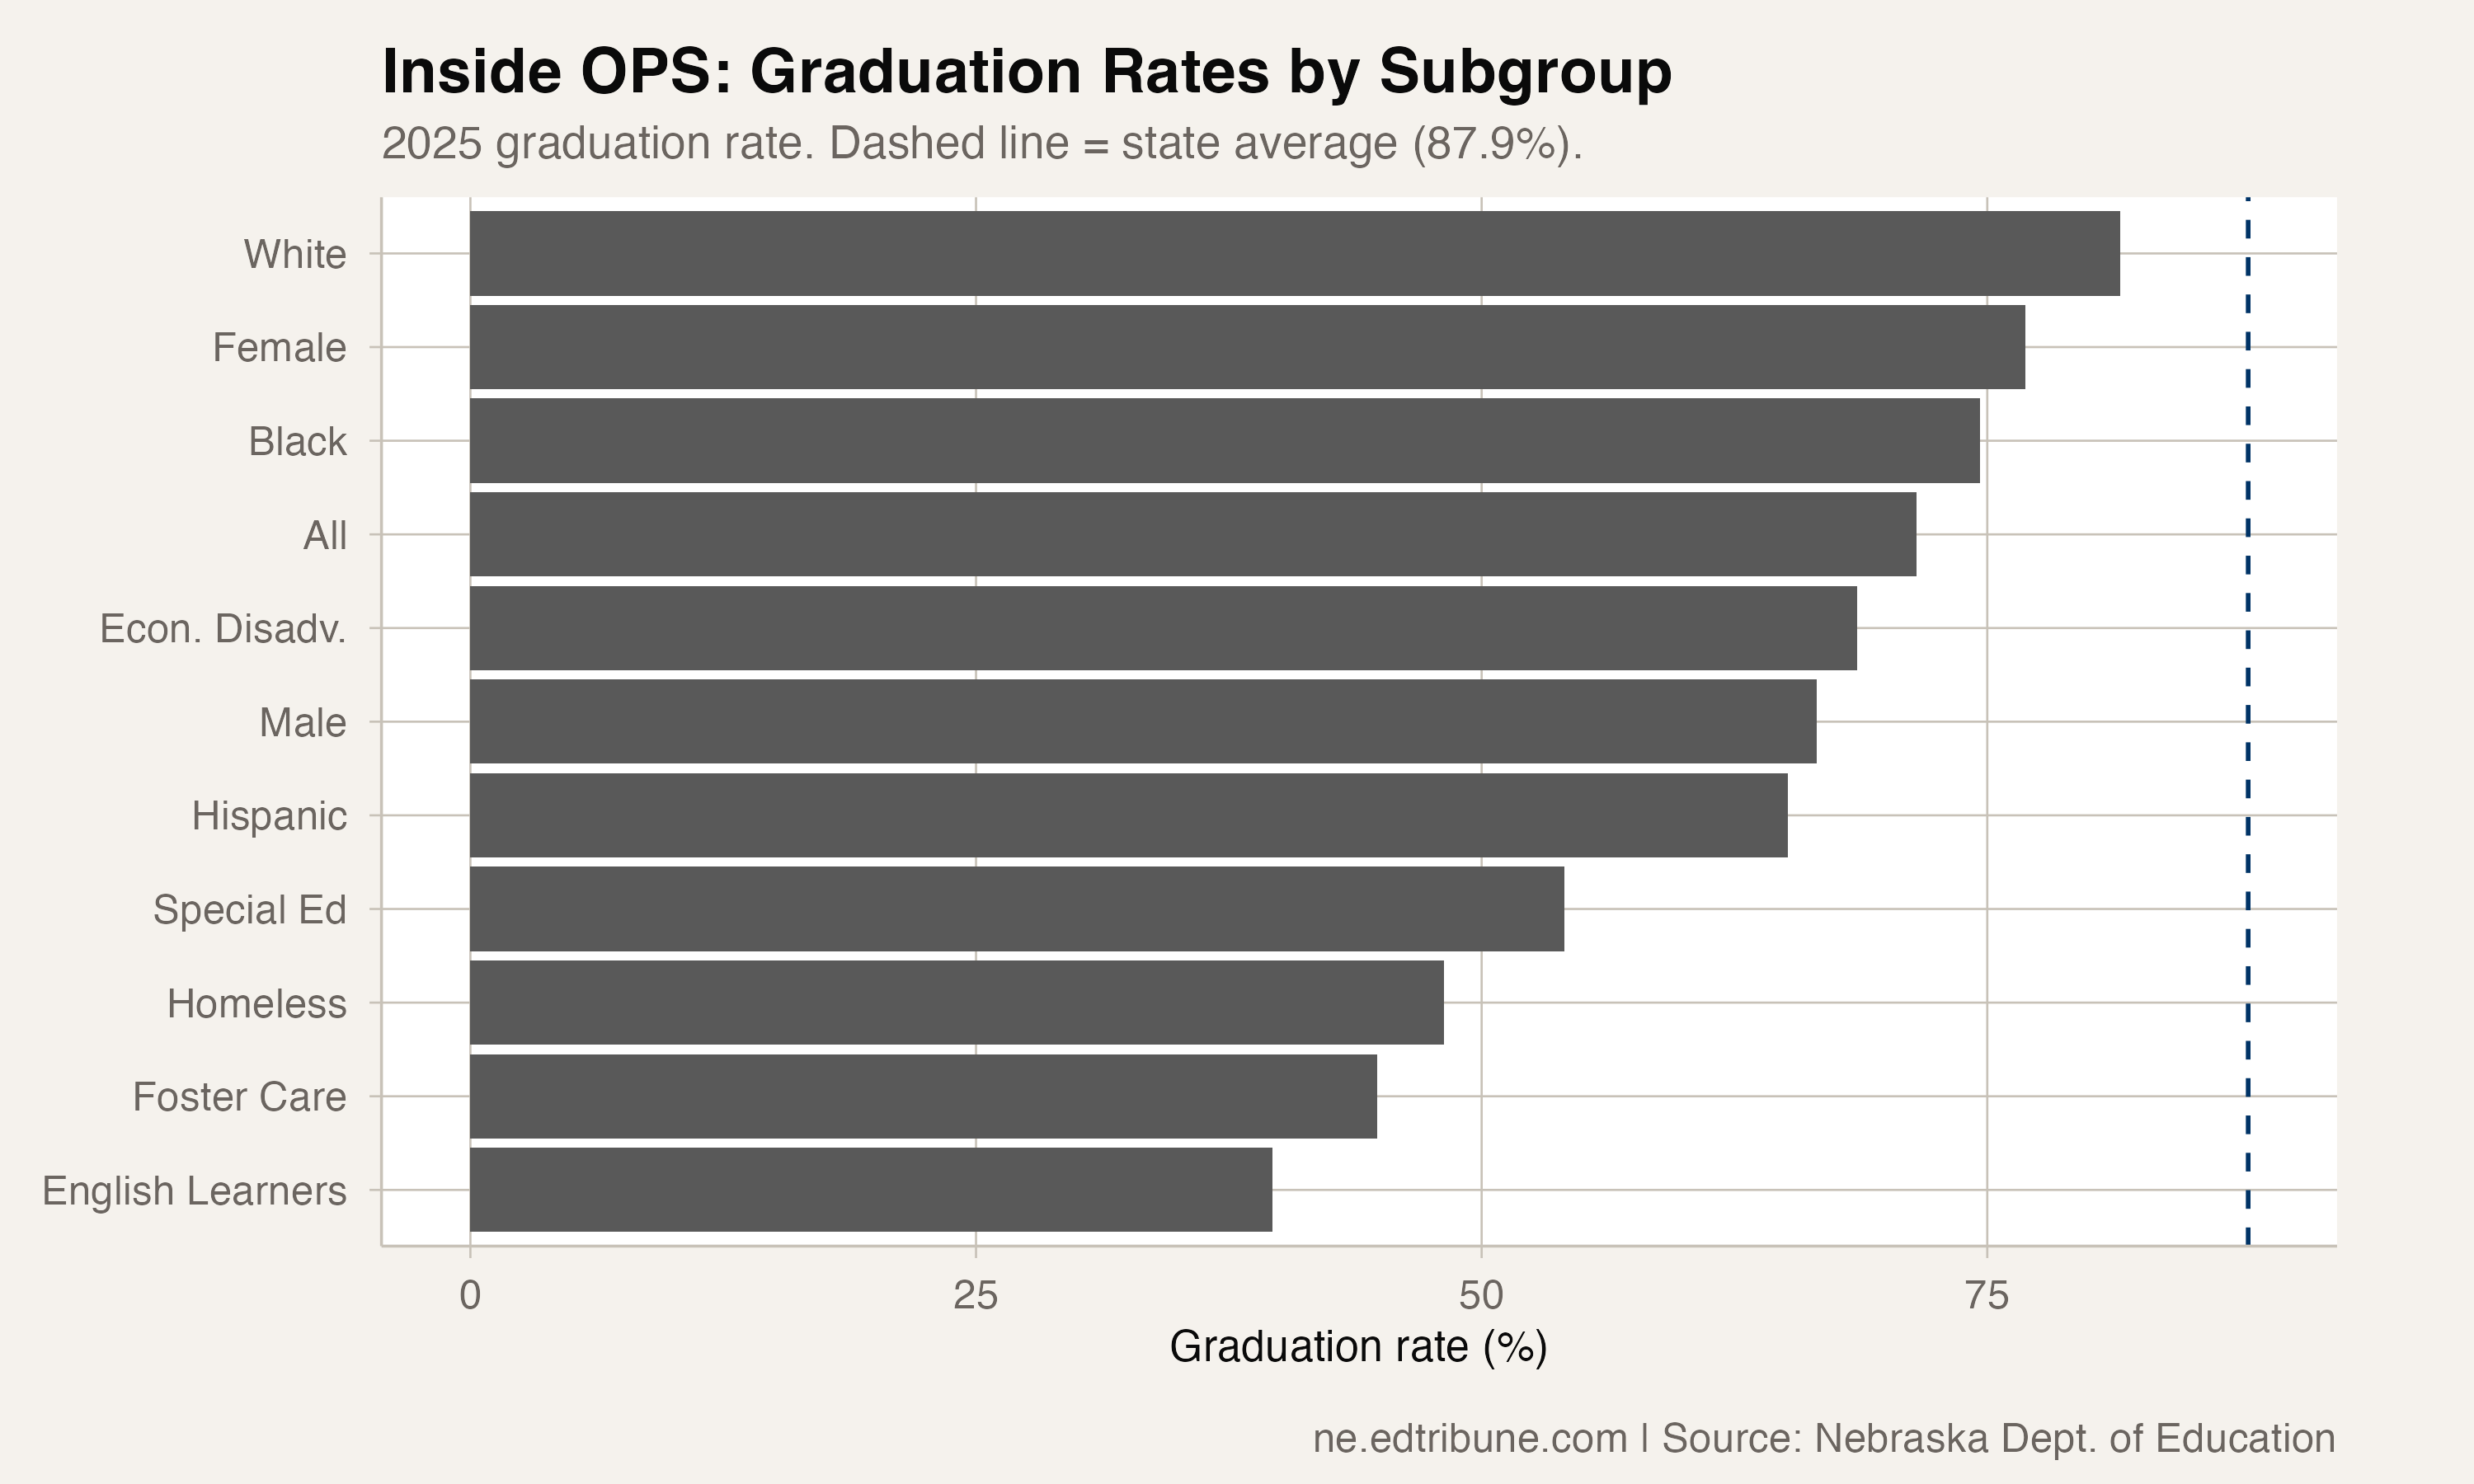
The subgroup breakdown at OPS in 2025 reveals a layered crisis. English learners graduated at 39.7% — meaning six out of every ten did not finish on time. The OPS LEP cohort of 711 students is larger than the entire senior classes of all but four Nebraska districts. Youth in foster care graduated at 44.8% and students who are currently homeless at 48.2%.
Students receiving special education services posted a 54.1% rate with 599 students in the cohort. Hispanic students, who make up 44.5% of the OPS cohort, graduated at 65.1%. Students who are economically disadvantaged finished at 68.6%.
White students at OPS graduated at 81.6% — below the statewide rate of 93.6% for white students, but well above the OPS average. The district's own racial composition means that even its highest-performing subgroup falls short of what suburban districts achieve across all groups.
The gender gap inside the gap
The OPS gender gap deserves its own examination. Males graduated at 66.6% in 2025 — one in three did not finish on time. Females posted 76.9%, producing a 10.3 percentage point gap that is more than double the statewide average gender gap of 4.3 points.
The male rate at OPS has been below 70% in four of the last six years. It bottomed out at 64.2% in 2022. Nearly 2,000 young men entered the OPS cohort in 2025; roughly 664 did not earn a diploma within four years.
The statewide male-female gap tells one story — modest, consistent, manageable at 4.3 points. The OPS gap tells another. At 10.3 points, it suggests systemic differences in how male students experience the district, from discipline patterns to course placement to engagement.
A growing cohort, a shrinking rate
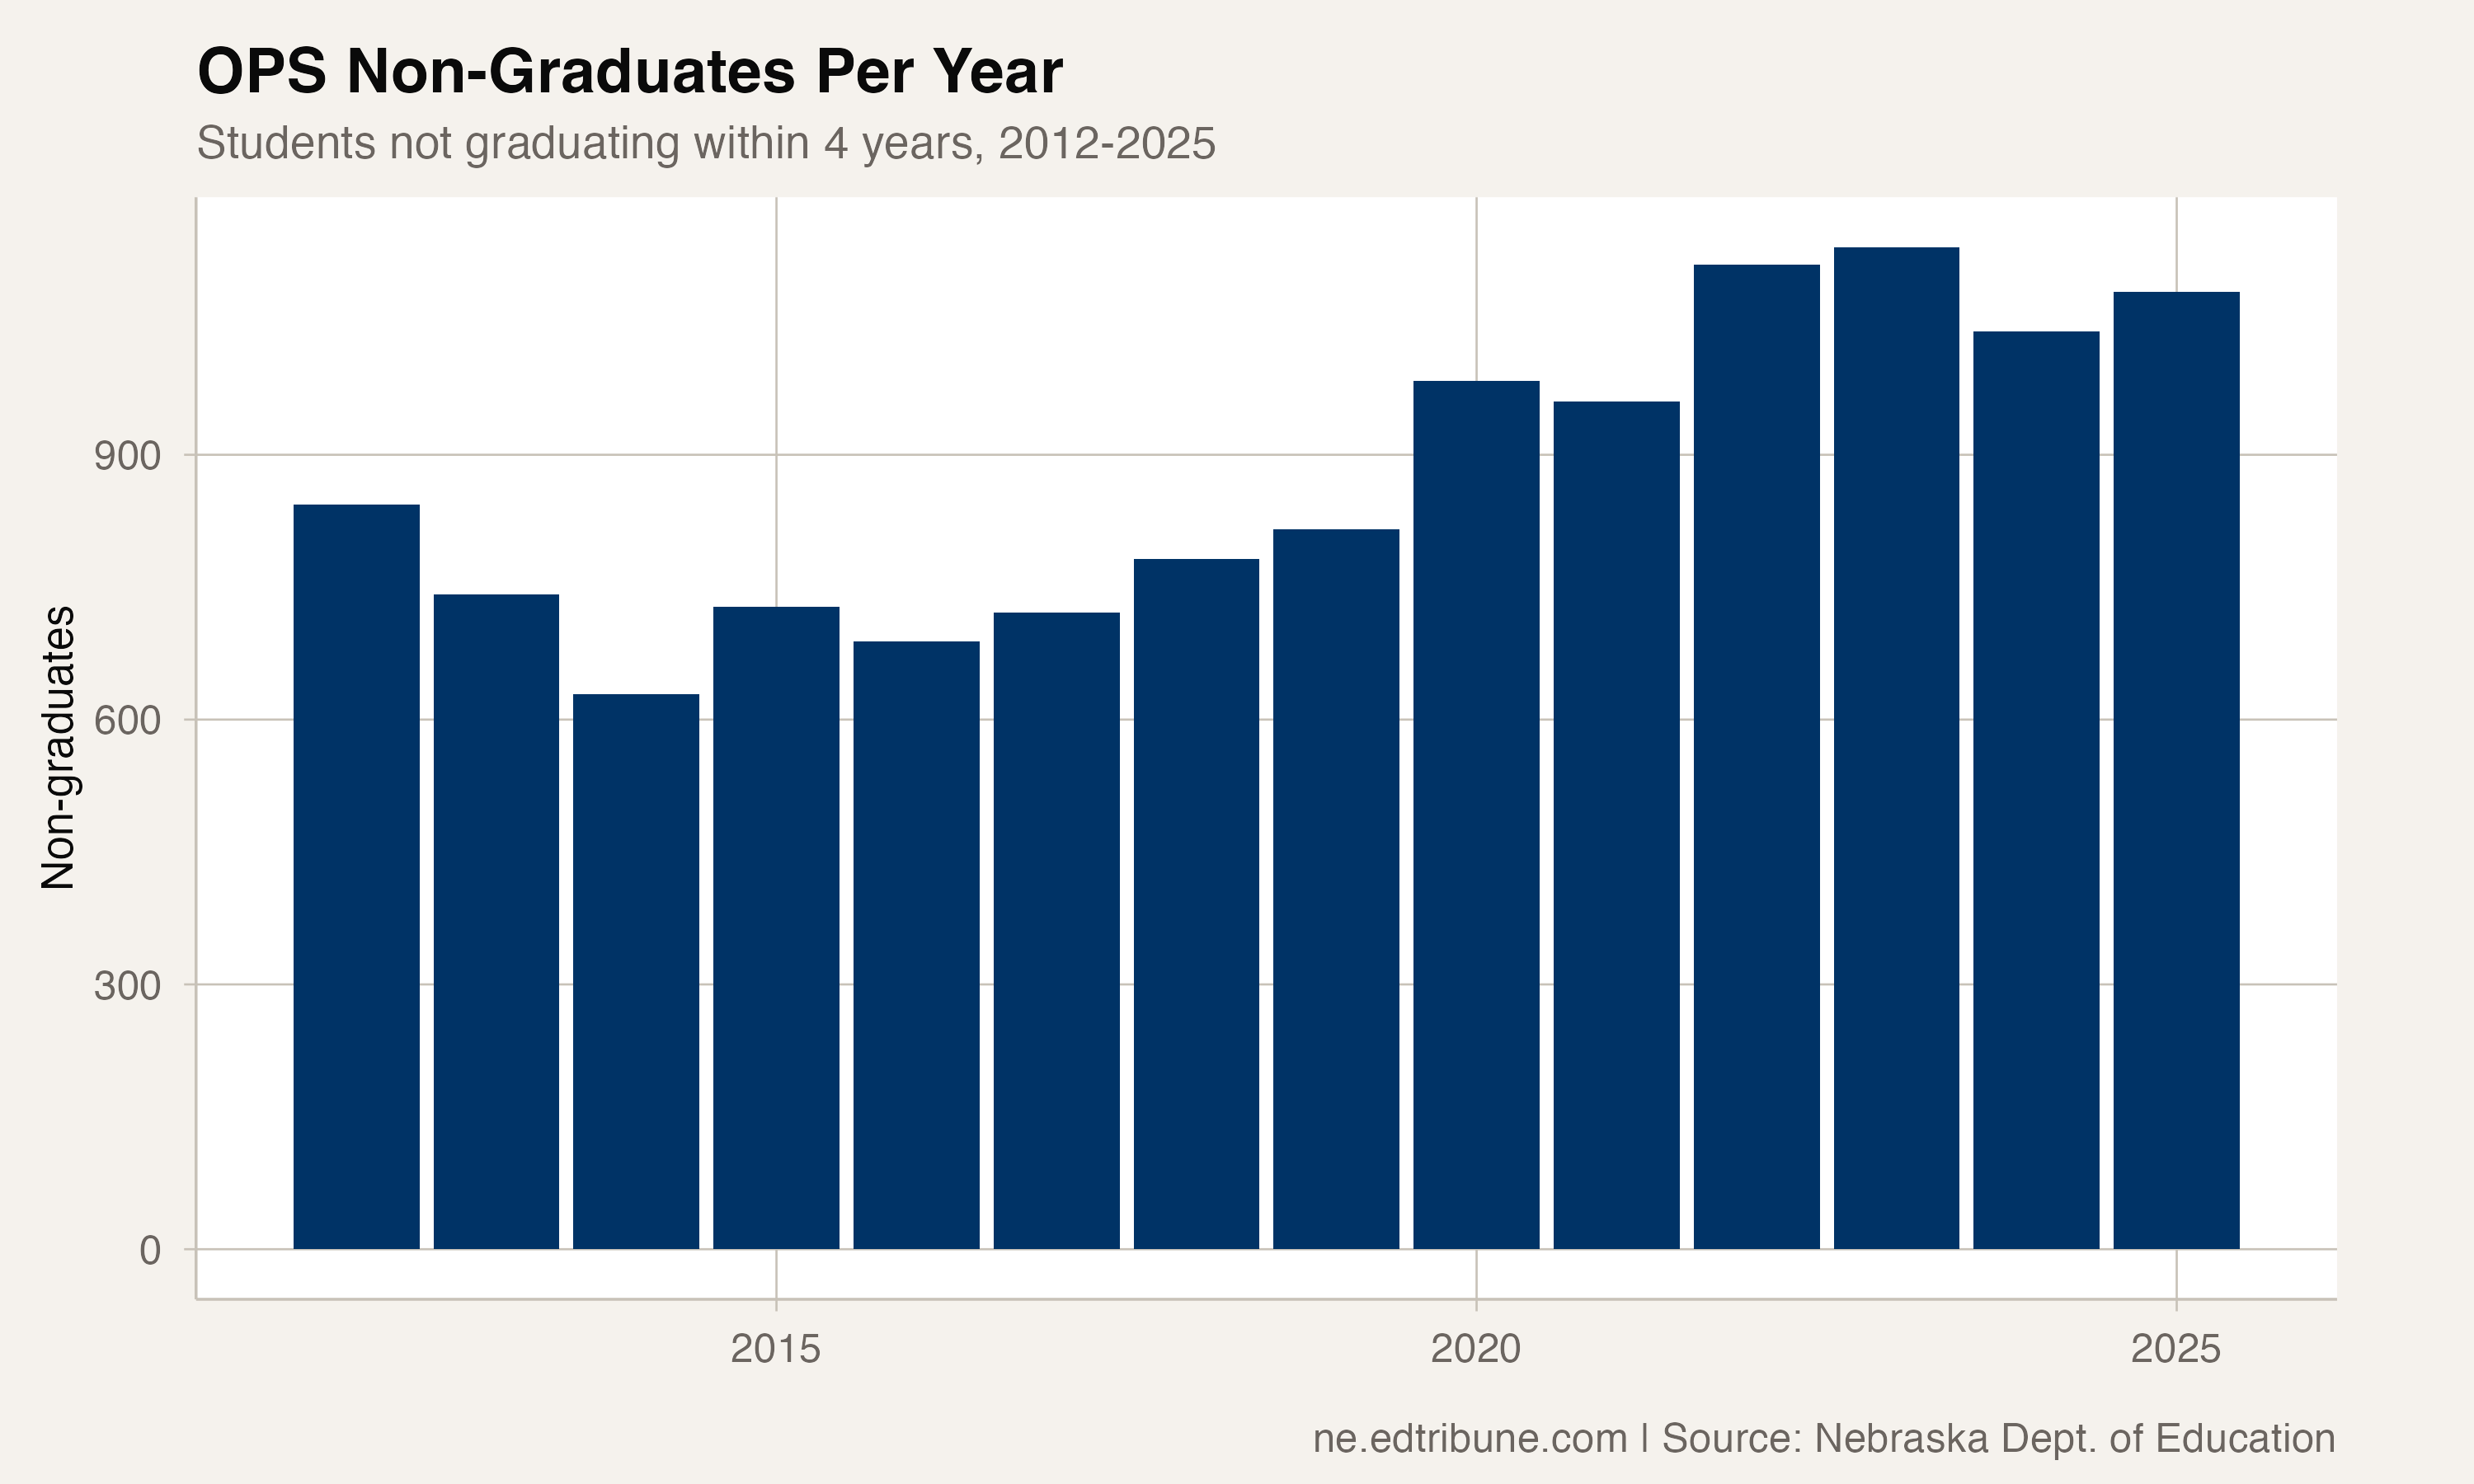
The OPS cohort has grown from 3,374 students in 2012 to 3,806 in 2025 — a 12.8% increase. But because the graduation rate has declined, the number of non-graduates has grown faster. In 2014, when OPS graduated 81%, roughly 630 students didn't finish on time. In 2025, at 71.5%, that number is 1,085.
The state as a whole has faced a similar dynamic on a smaller scale. Nebraska's overall cohort has grown from 21,658 to 24,167 while the rate has declined from its 2014 peak of 90% to 87.9%. The state now produces roughly 2,924 non-graduates per year compared to 2,165 in 2014. OPS accounts for 37% of that total — far exceeding its 15.7% share of the state's graduating cohort.
The Lincoln comparison
OPS serves 71 languages, nearly half its cohort classified as economically disadvantaged, the state's largest concentration of refugees and recent immigrants. But Lincoln Public Schools serves a demographically comparable population and graduates 13 points higher. The gap between Omaha and Lincoln is itself larger than the gap between most states.
Graduation rates are outputs. They do not distinguish between a student who left the state, a student who transferred to a private school, a student who dropped out, and a student who needed a fifth year. But 1,085 students per year not finishing on time is a scale of failure that no accounting adjustment can explain away.
Detailed code that reproduces the analysis and figures in this article is available exclusively to EdTribune subscribers.
Discussion
Sign in to join the discussion.
Loading comments...