The number arrives without context if you look at it quickly: 52.2%. That is the share of Nebraska's English learners who graduated on time in 2025. Nearly half did not.
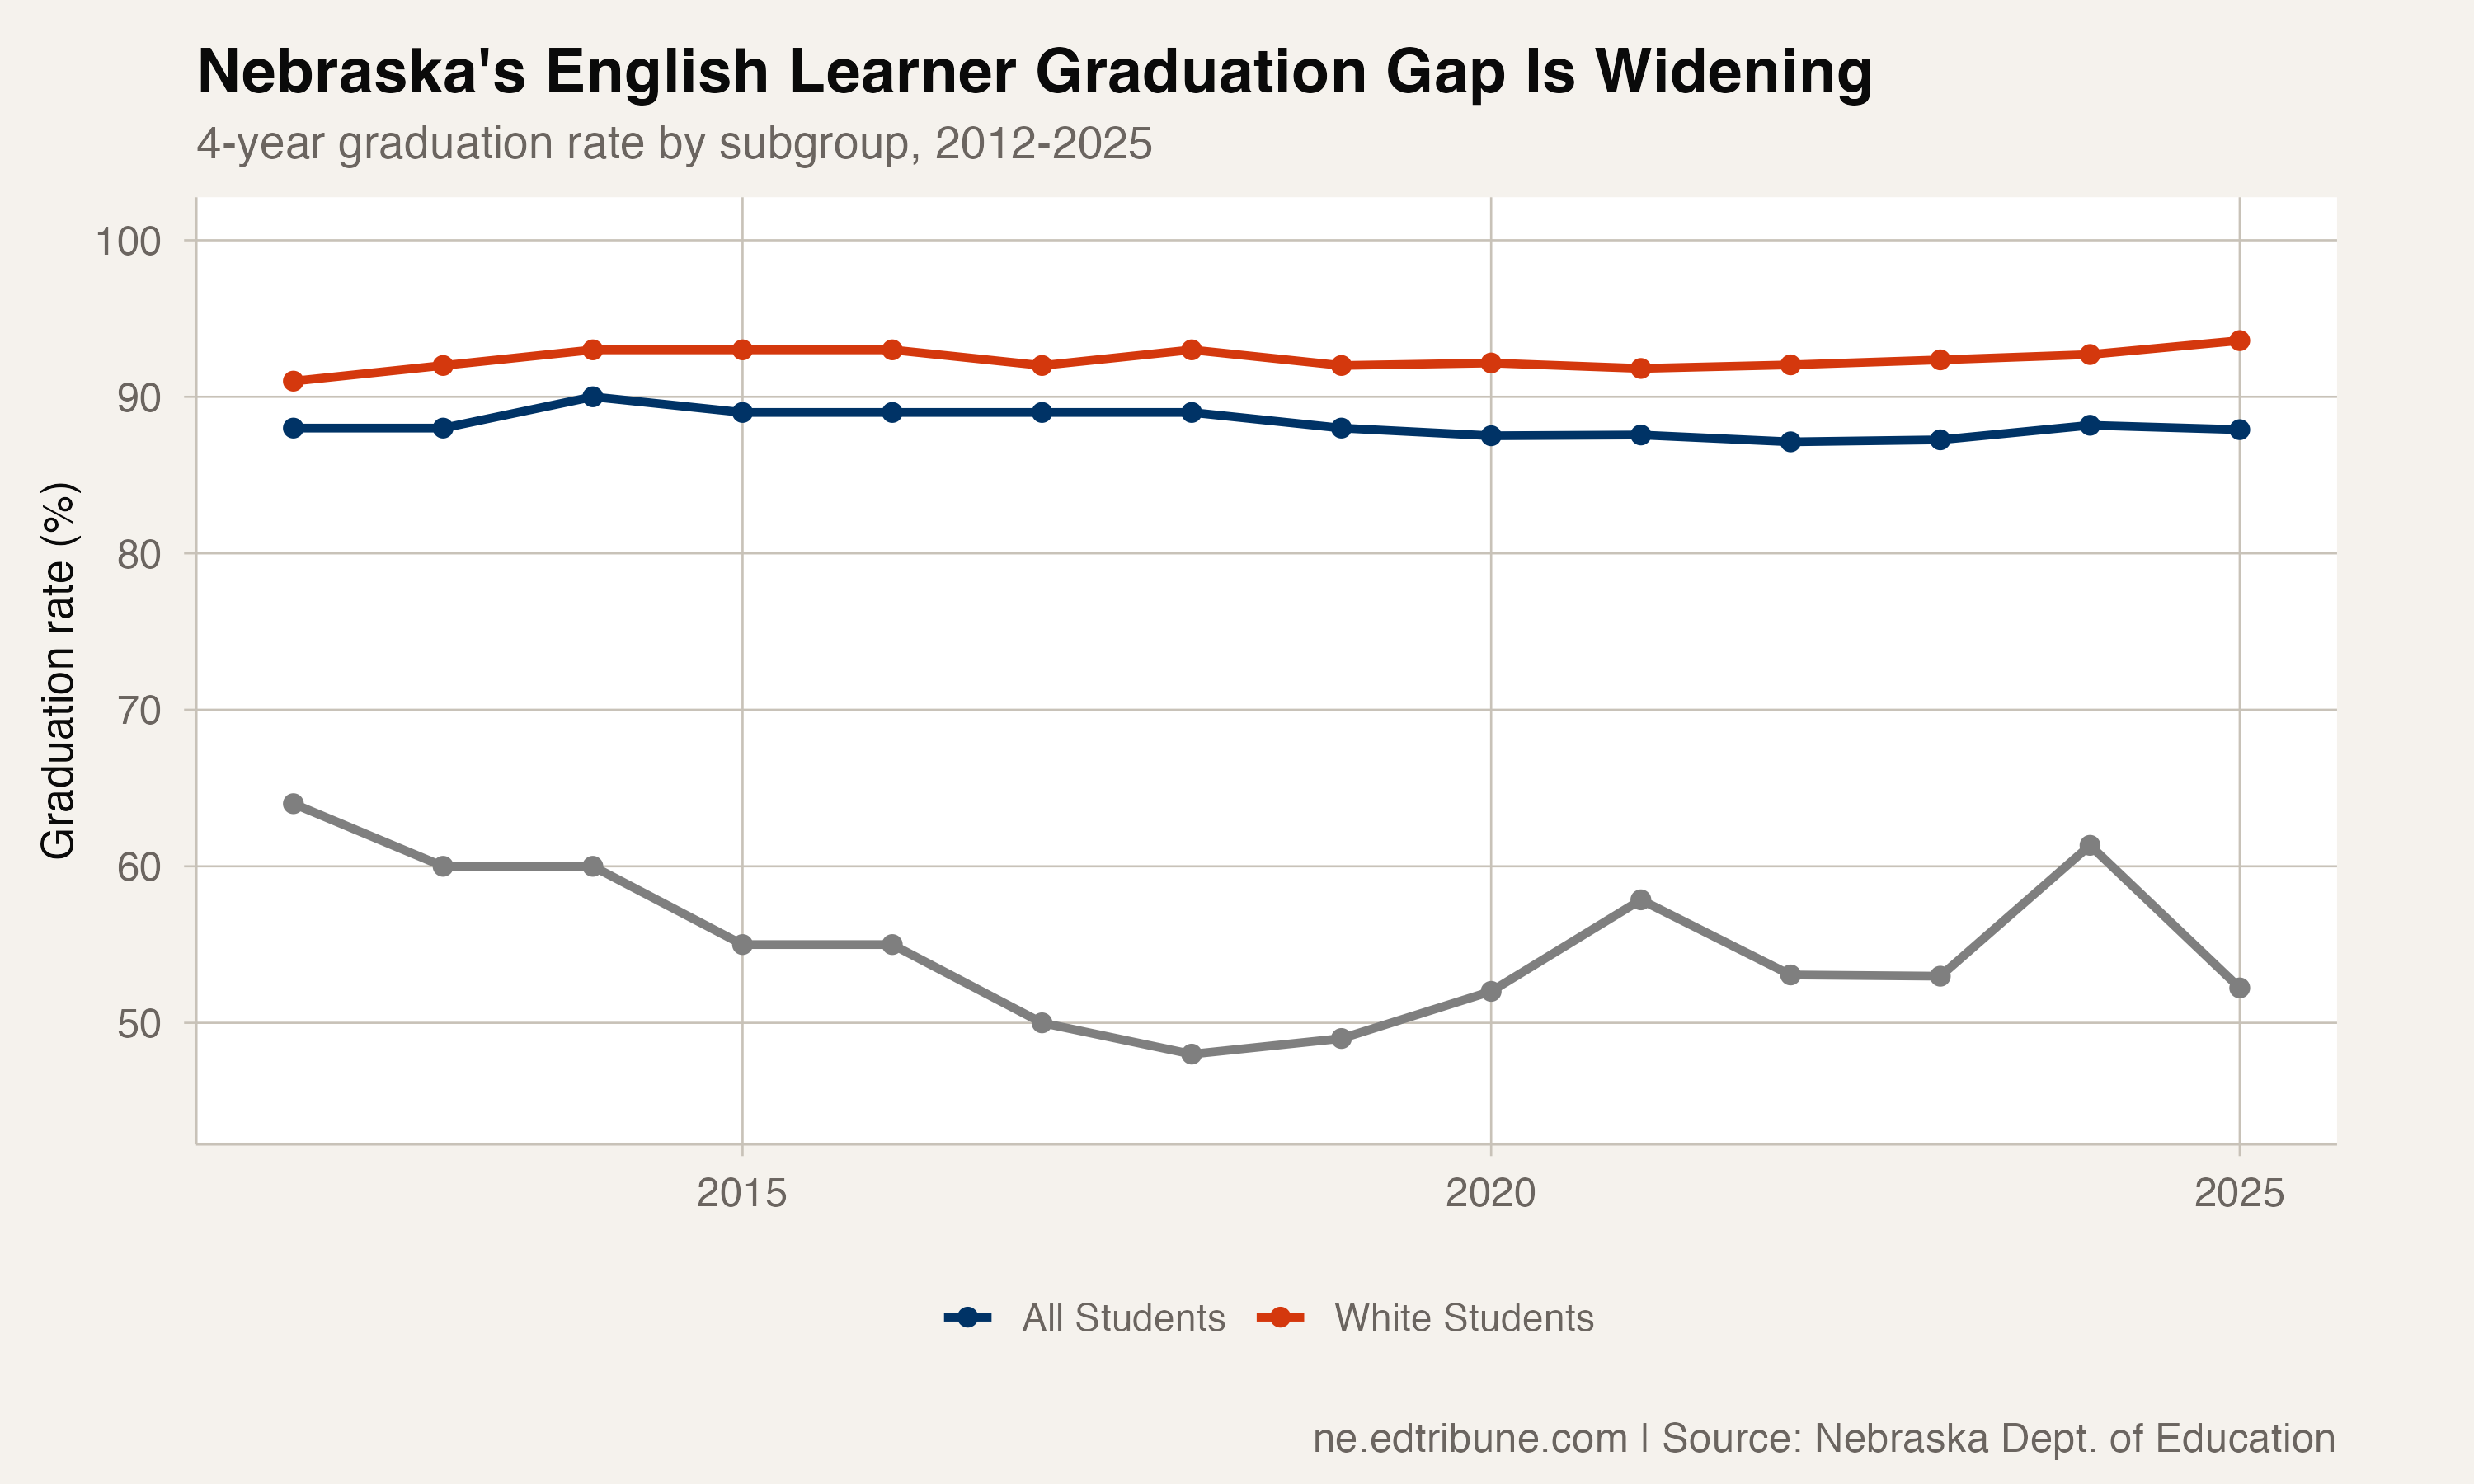
What makes the figure harder to absorb is that it used to be better. In 2012, when the state first tracked four-year graduation rates by subgroup, 64% of English learners finished on time. Over the 14 years since, the rate has fallen almost 12 percentage points while the statewide average has barely budged, drifting from 88% to 87.9%.
The white graduation rate, meanwhile, has climbed to 93.6% — its highest on record. The gap between white students and English learners now stands at 41.4 percentage points, the widest equity chasm in Nebraska's graduation data.
A cohort that doubled while outcomes worsened
The math has gotten worse in two directions simultaneously. The English learner cohort has more than doubled from 884 students in 2012 to 1,882 in 2025 — a 113% increase. But the 2024-to-2025 jump alone accounts for nearly a third of that growth: the cohort surged by 613 students in a single year, a 48.3% increase that may reflect reclassification, new arrivals, or shifting methodology as much as genuine population growth.
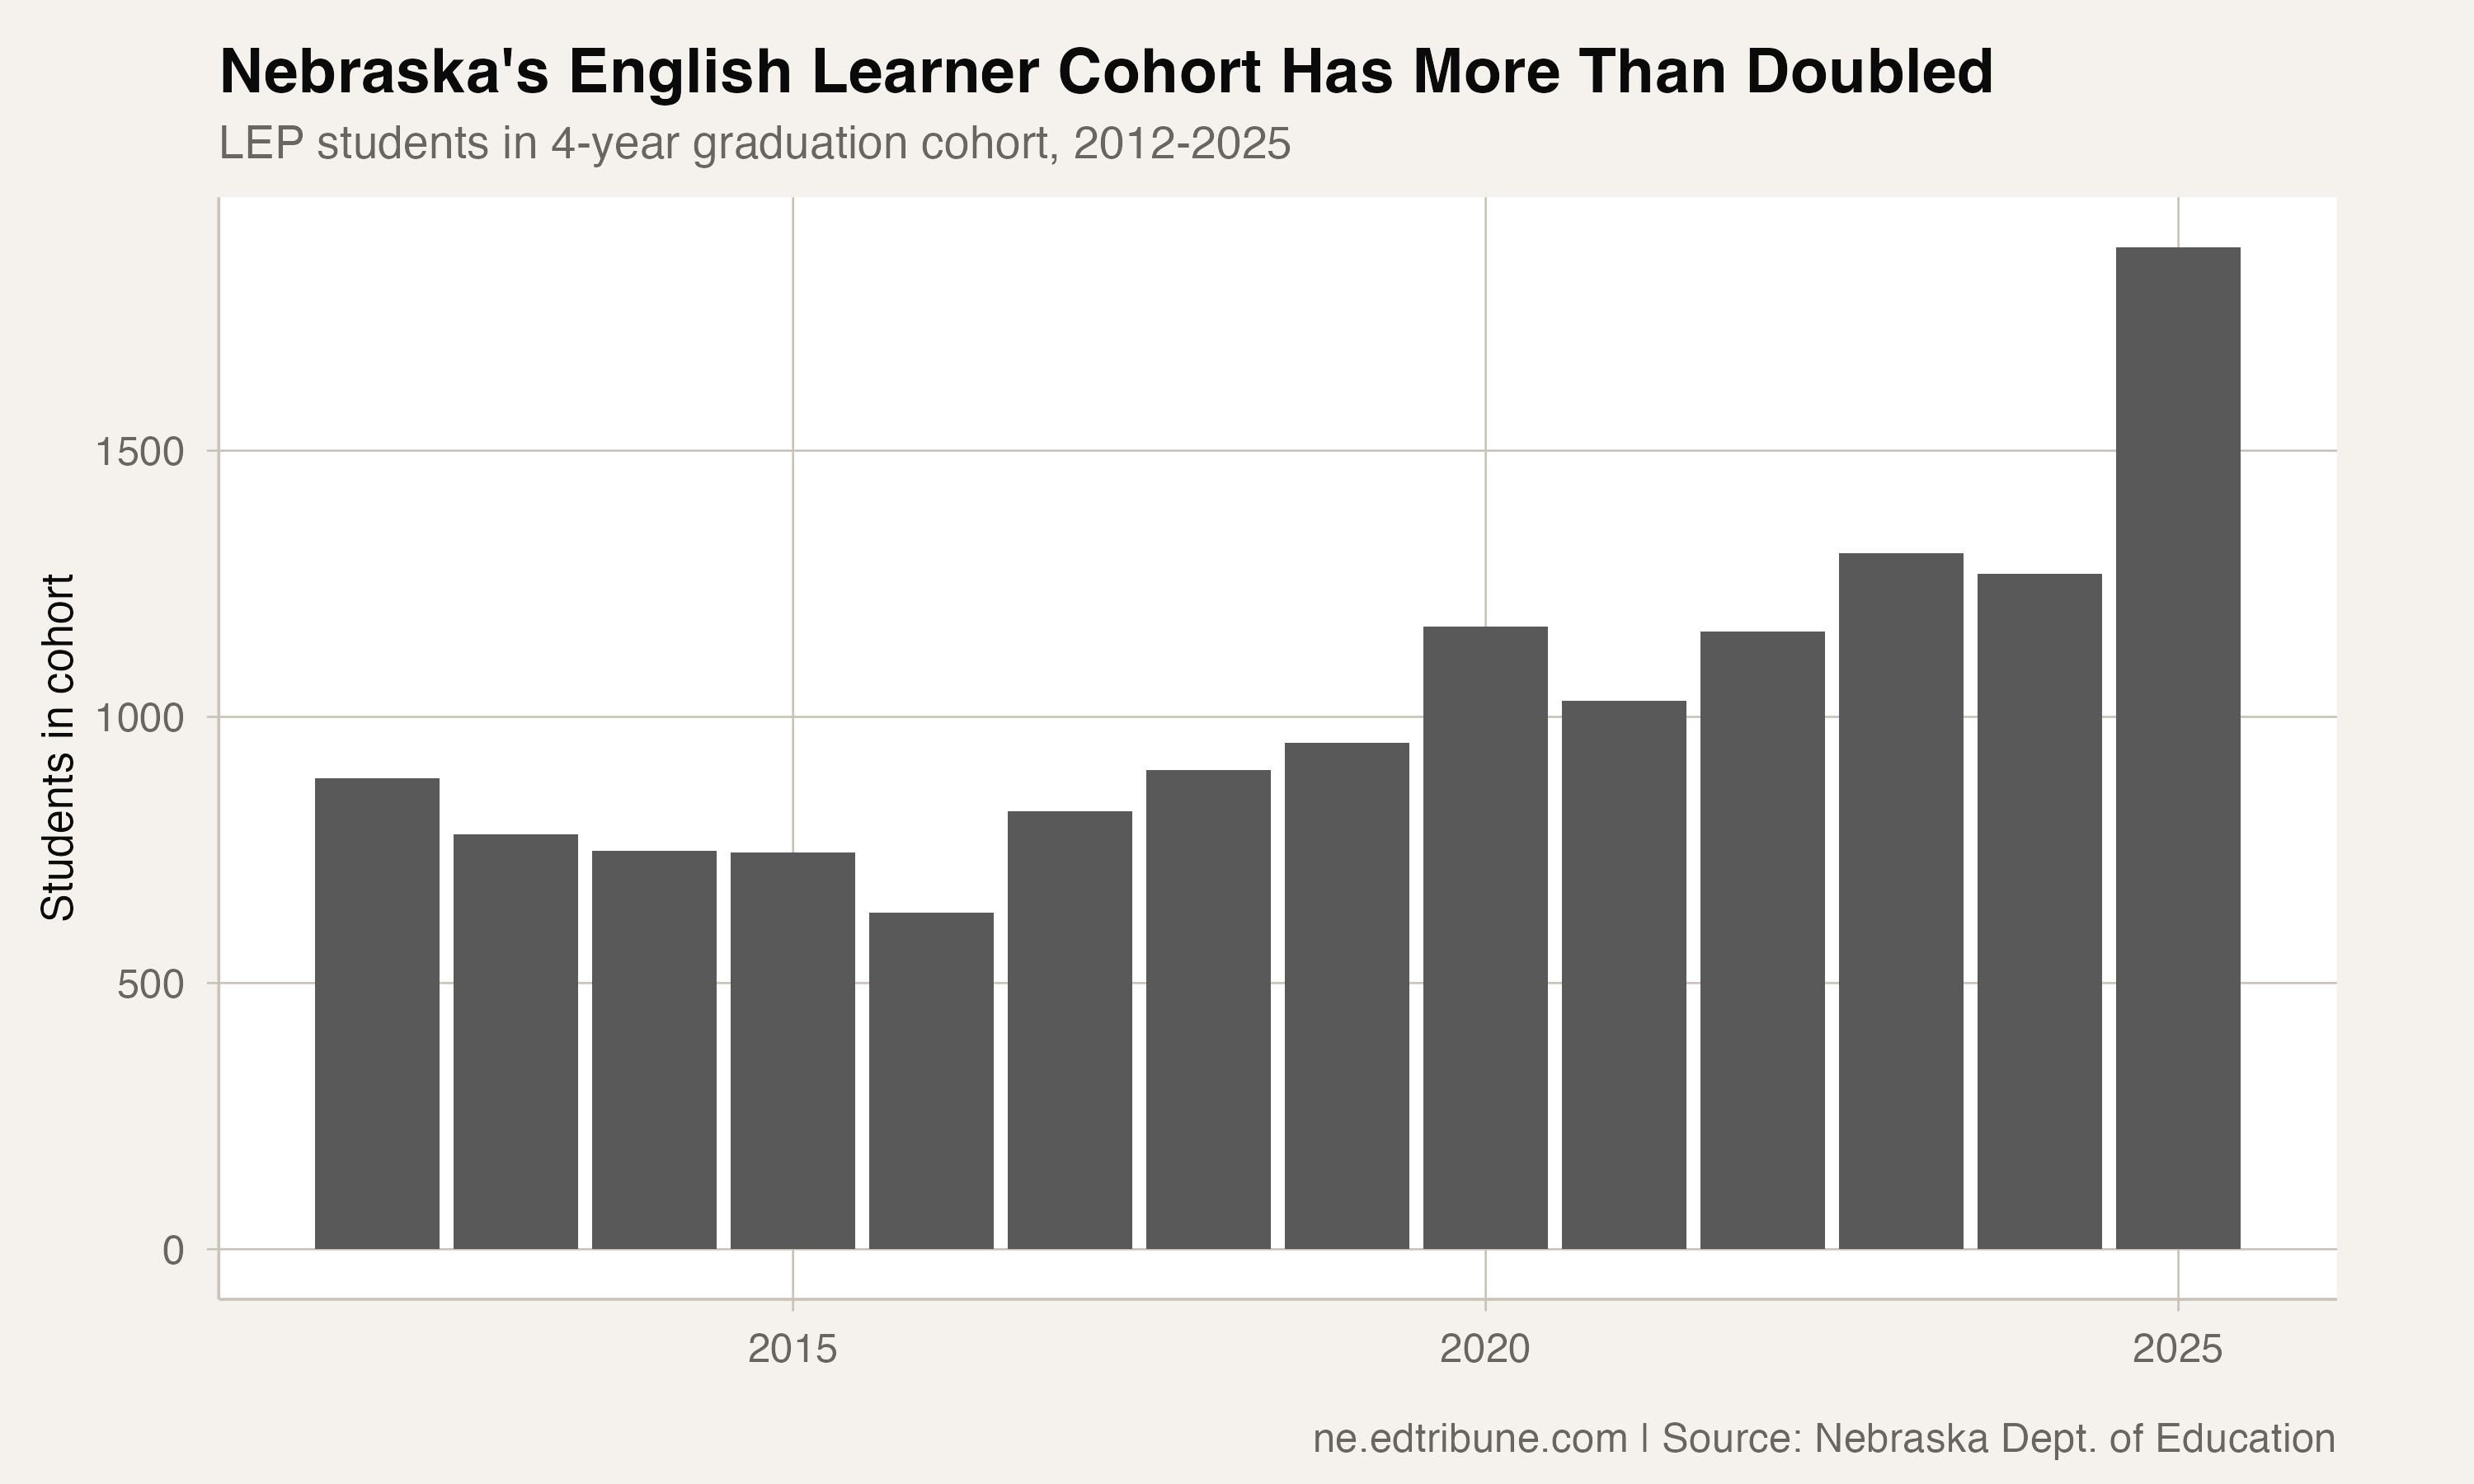
In raw numbers, this means 899 English learners did not graduate on time in 2025 — compared to roughly 318 in 2012. The state is producing nearly three times as many LEP non-graduates per year as it did a decade ago.
The trajectory has not been a steady decline. The rate bottomed out at 48% in 2018, recovered somewhat during and after COVID (reaching 61.3% in 2024), and then plunged back to 52.2% in 2025. That single-year drop of 9.1 percentage points, coinciding with the 48% cohort surge, suggests the newest entrants to the cohort arrived with significant gaps in credit accumulation.
Where the gaps live
The 16 districts that report English learner graduation data in 2025 tell a story of enormous variation. At the top, Kearney Public Schools graduated 94.1% of its 16 LEP students. Schuyler Community Schools, where the meatpacking industry shapes the student body, graduated 81.4% of 58 English learners. Lexington Public Schools posted 79.7% with 69 students.
At the bottom, the state's three largest districts are also its worst performers for English learners. Omaha Public Schools graduated just 39.7% of 711 LEP students — meaning 429 English learners in Omaha alone did not finish on time. Ralston Public Schools, a small enclave surrounded by Omaha, graduated 31.7% of its 40 LEP students. Grand Island Public Schools posted 42.5% with 186 English learners, a figure the district attributes partly to a one-time "bubble" caused by a policy change in how incoming ELL students were enrolled.
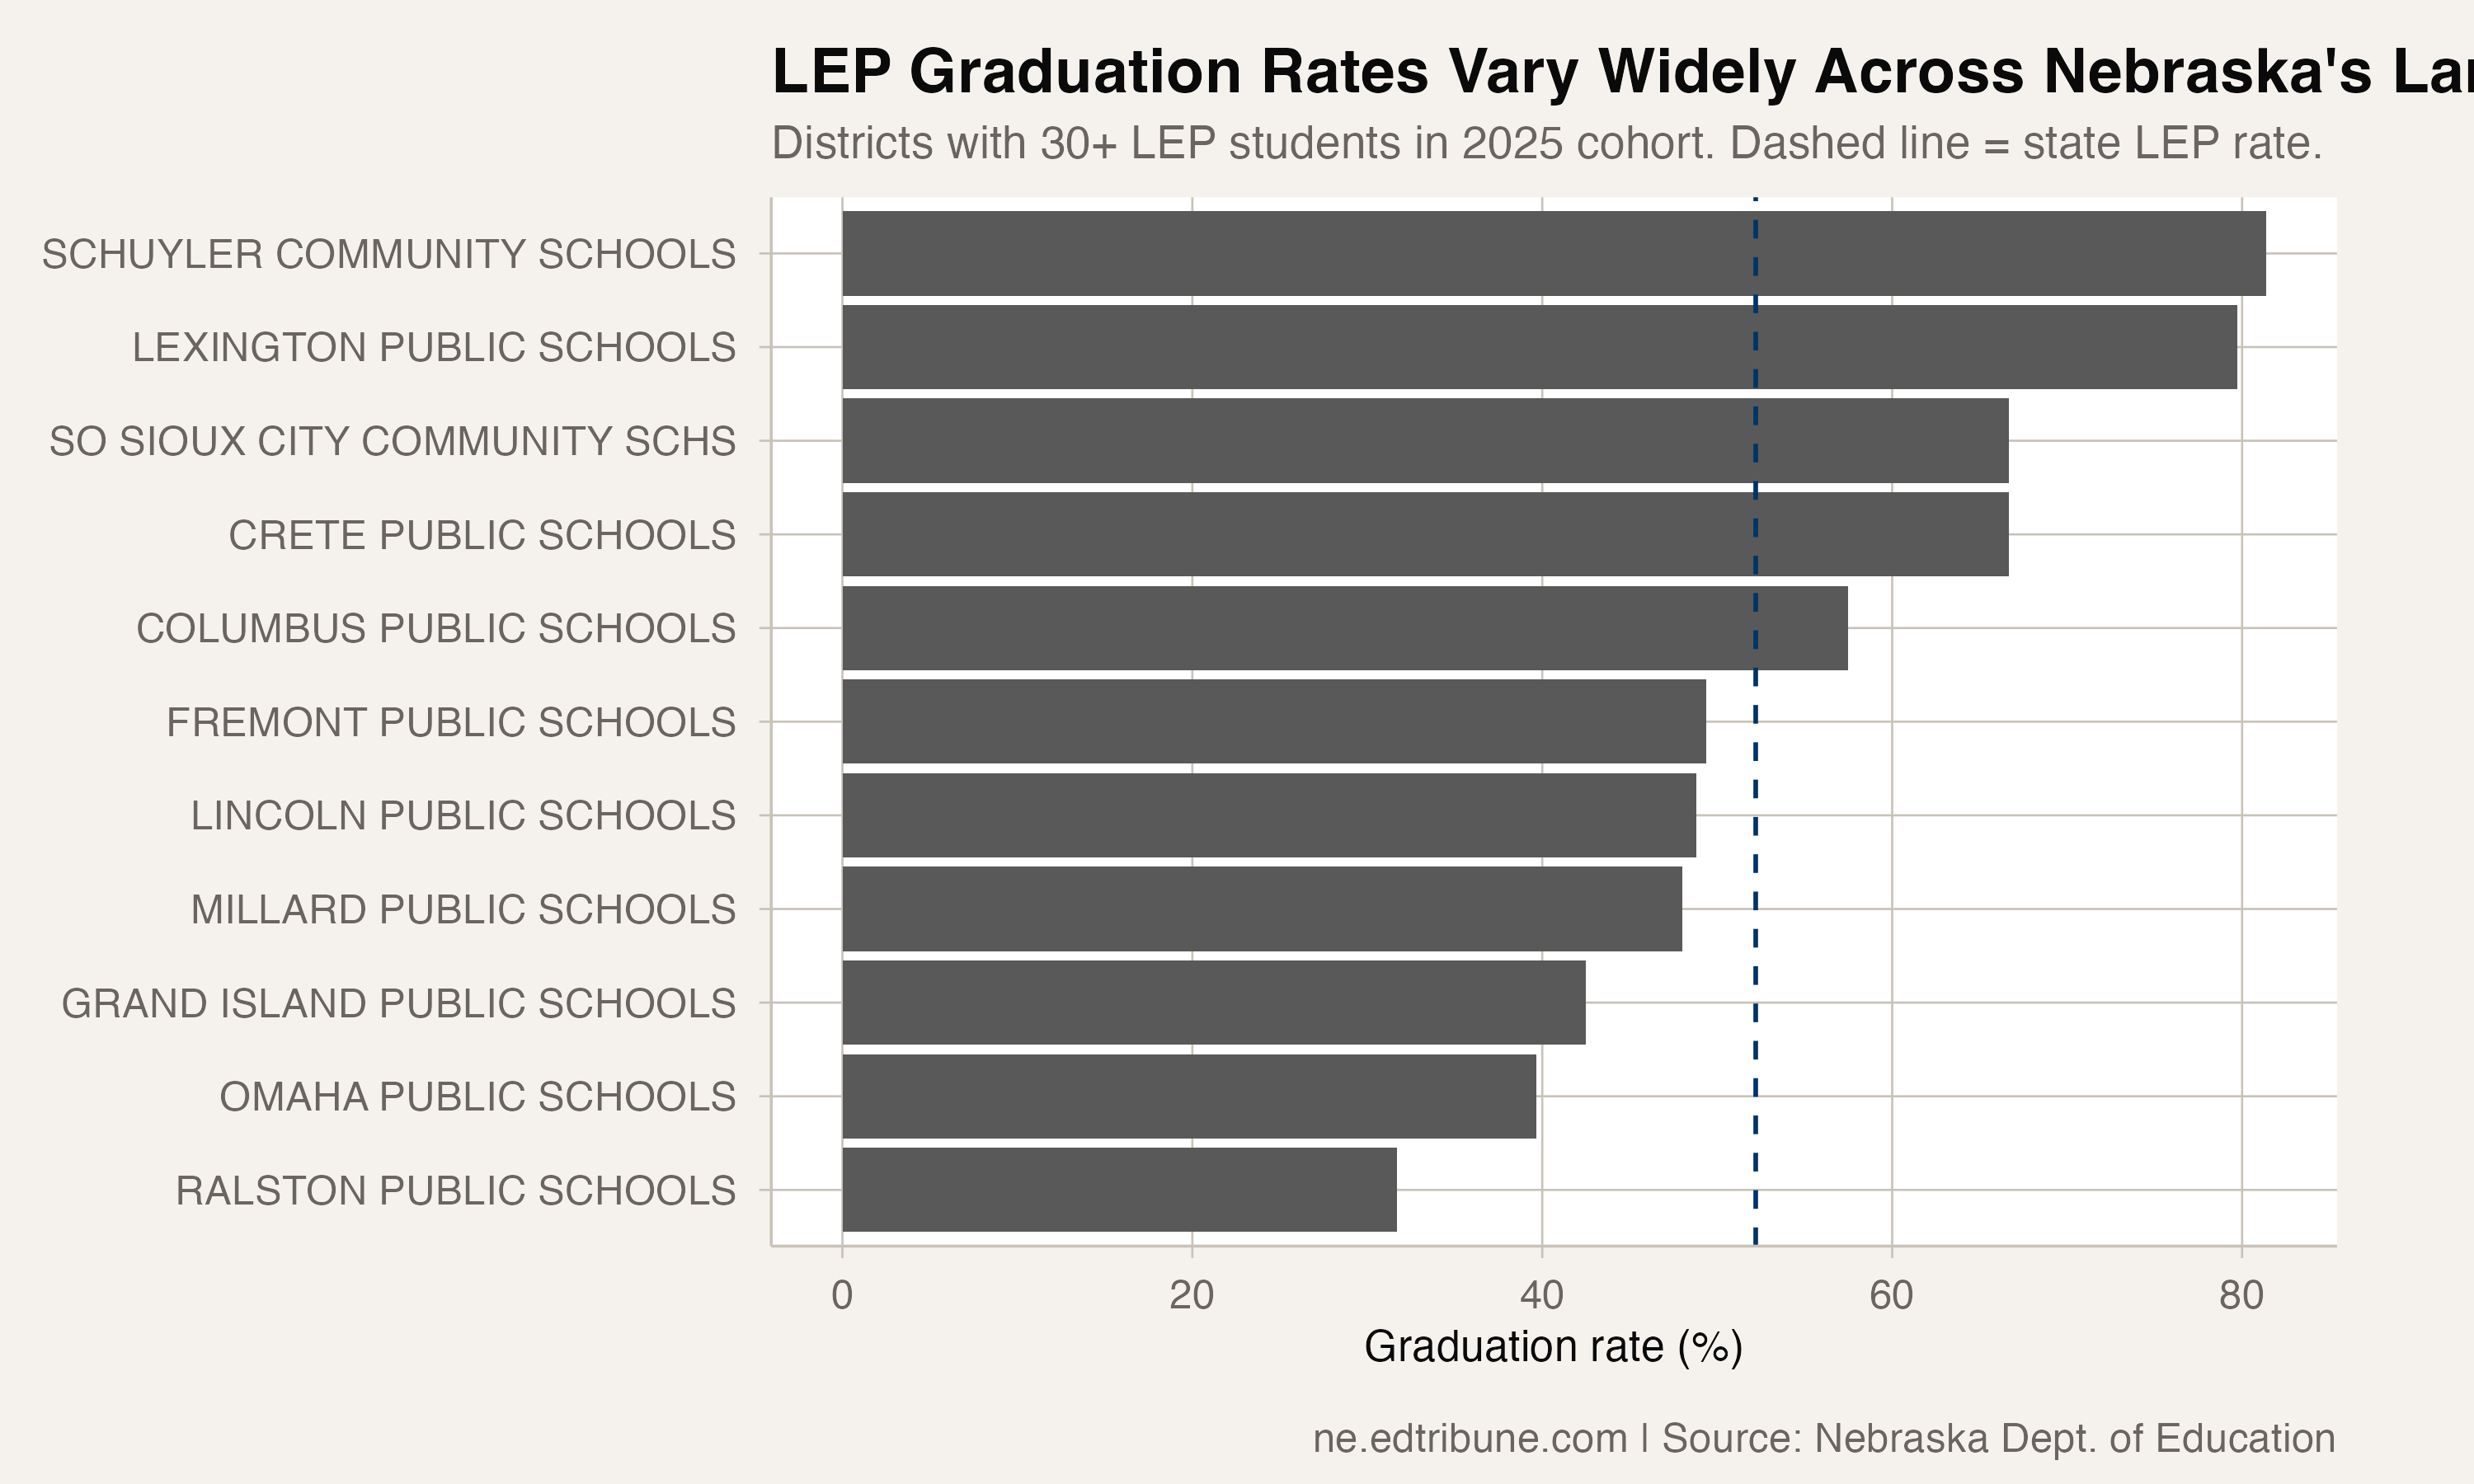
Lincoln Public Schools, the state's second-largest district, graduated 48.8% of 253 English learners. Fremont Public Schools posted 49.4% with 81 students.
The variation matters because it demonstrates this is not demographic destiny. Districts with similar student populations produce dramatically different results. Schuyler and Lexington both serve heavily Hispanic, meatpacking-economy communities and both graduate their English learners at rates 30 to 40 percentage points above Omaha's.
The gap that keeps widening
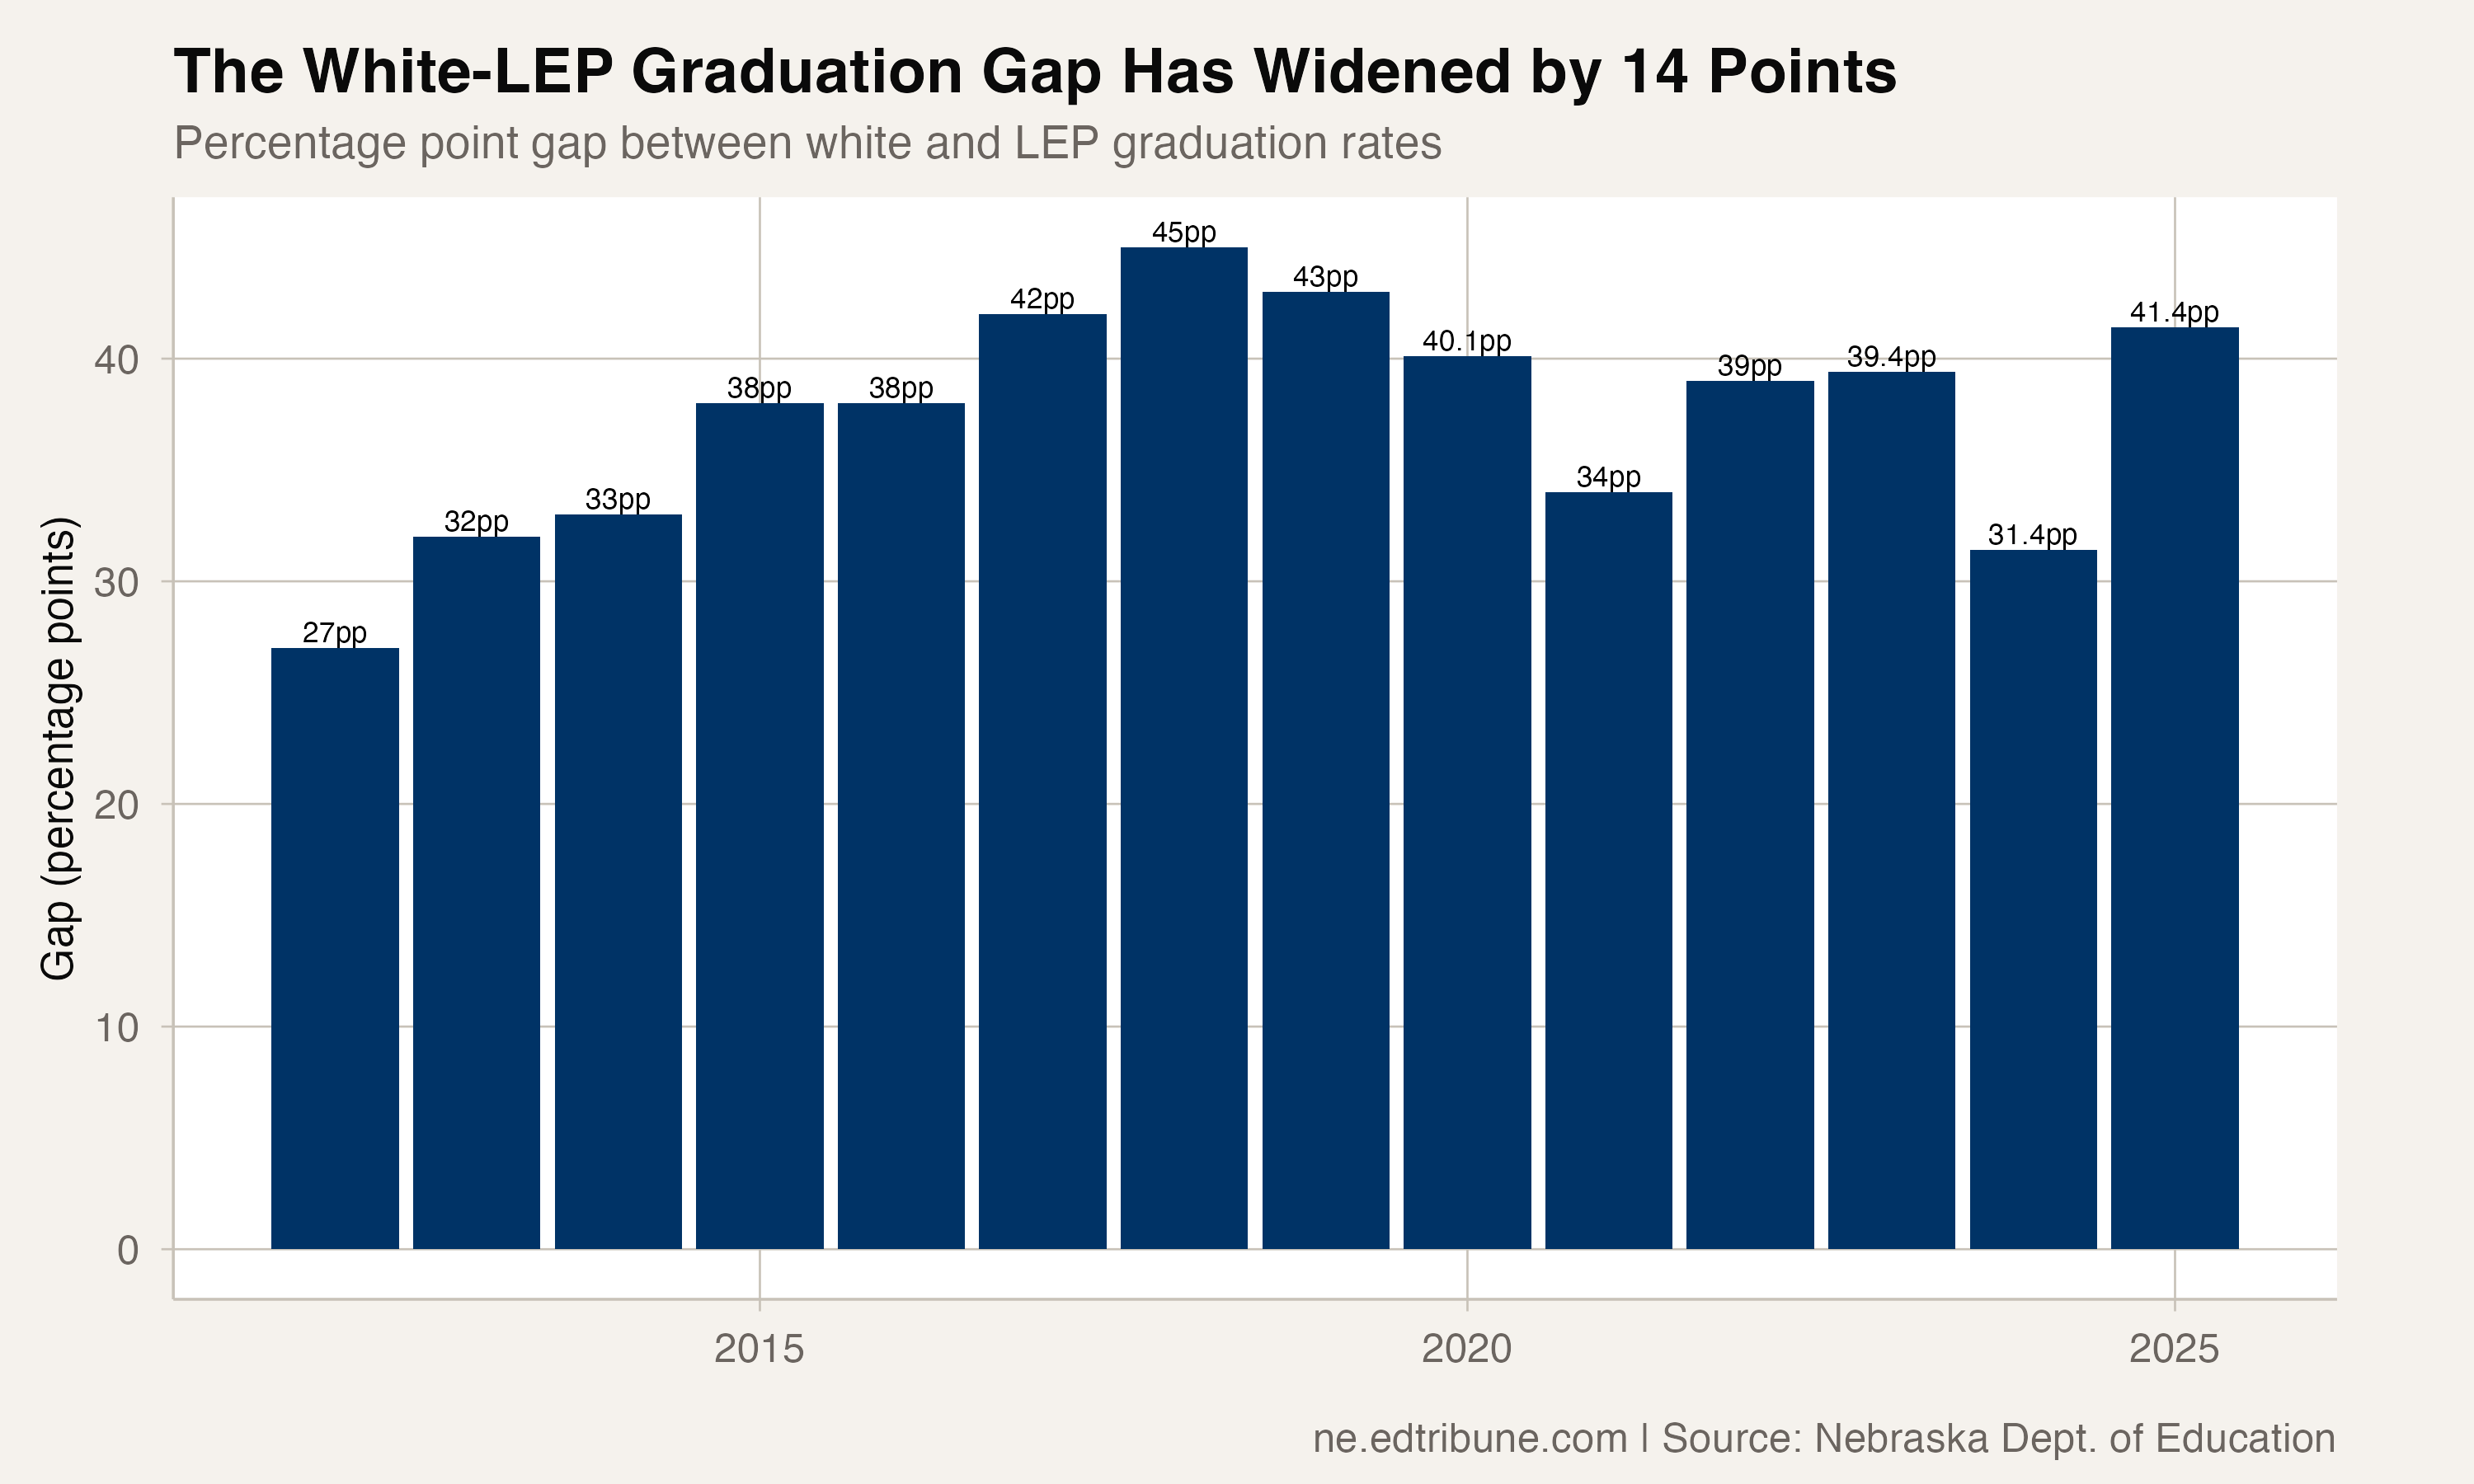
In 2012, the white-LEP gap was 27 percentage points — already large by any standard. By 2018, it had ballooned to 45 points. A brief narrowing followed, reaching 31.4 points in 2024, before snapping back to 41.4 points in 2025.
Nebraska's equity gaps in graduation rates are among the widest nationally, comparable to Connecticut and the District of Columbia for the largest white-minority achievement gaps. The gap between English learners and the state average has widened from 24 percentage points in 2012 to 35.7 points in 2025.
What the four-year rate does not capture
Nebraska reports only the four-year adjusted cohort graduation rate. Many states also publish five-year extended rates that capture students who need an additional year to complete requirements. For English learners — students simultaneously mastering content in a new language and accumulating credits — the four-year window is particularly unforgiving.
The state requires 200 credit hours and 80% core curriculum for graduation. A student who arrives in ninth grade speaking little English faces the same four-year clock as a native speaker. Some districts have responded by enrolling incoming ELL students as freshmen regardless of age, a practice Grand Island recently ended. Others have expanded dual-credit and CTE pathways that allow students to earn credit through work-based learning.
Nebraska added a personal finance requirement starting with the 2023-24 school year and will add a computer science requirement in 2027-28. Each additional requirement raises the bar for students who may already be juggling language acquisition, cultural adjustment, and family obligations.
The scale of what's at stake
The 1,882 English learners in the 2025 graduation cohort represent the tip of a much larger pipeline. Roughly 65,000 Nebraska students — 21% of the total — were chronically absent during the 2024-25 school year, disproportionately students of color, students with disabilities, and economically disadvantaged students. The connection between chronic absence and graduation is well documented: students who miss 10% or more of school days are far less likely to accumulate the credits needed to finish on time.
For the 899 English learners who did not graduate in 2025, the four-year rate is a snapshot, not a sentence. Some will earn diplomas later. But the trend line across 14 years of data points in one direction, and the cohort is growing faster than the state's capacity to serve it.
Detailed code that reproduces the analysis and figures in this article is available exclusively to EdTribune subscribers.
Discussion
Sign in to join the discussion.
Loading comments...