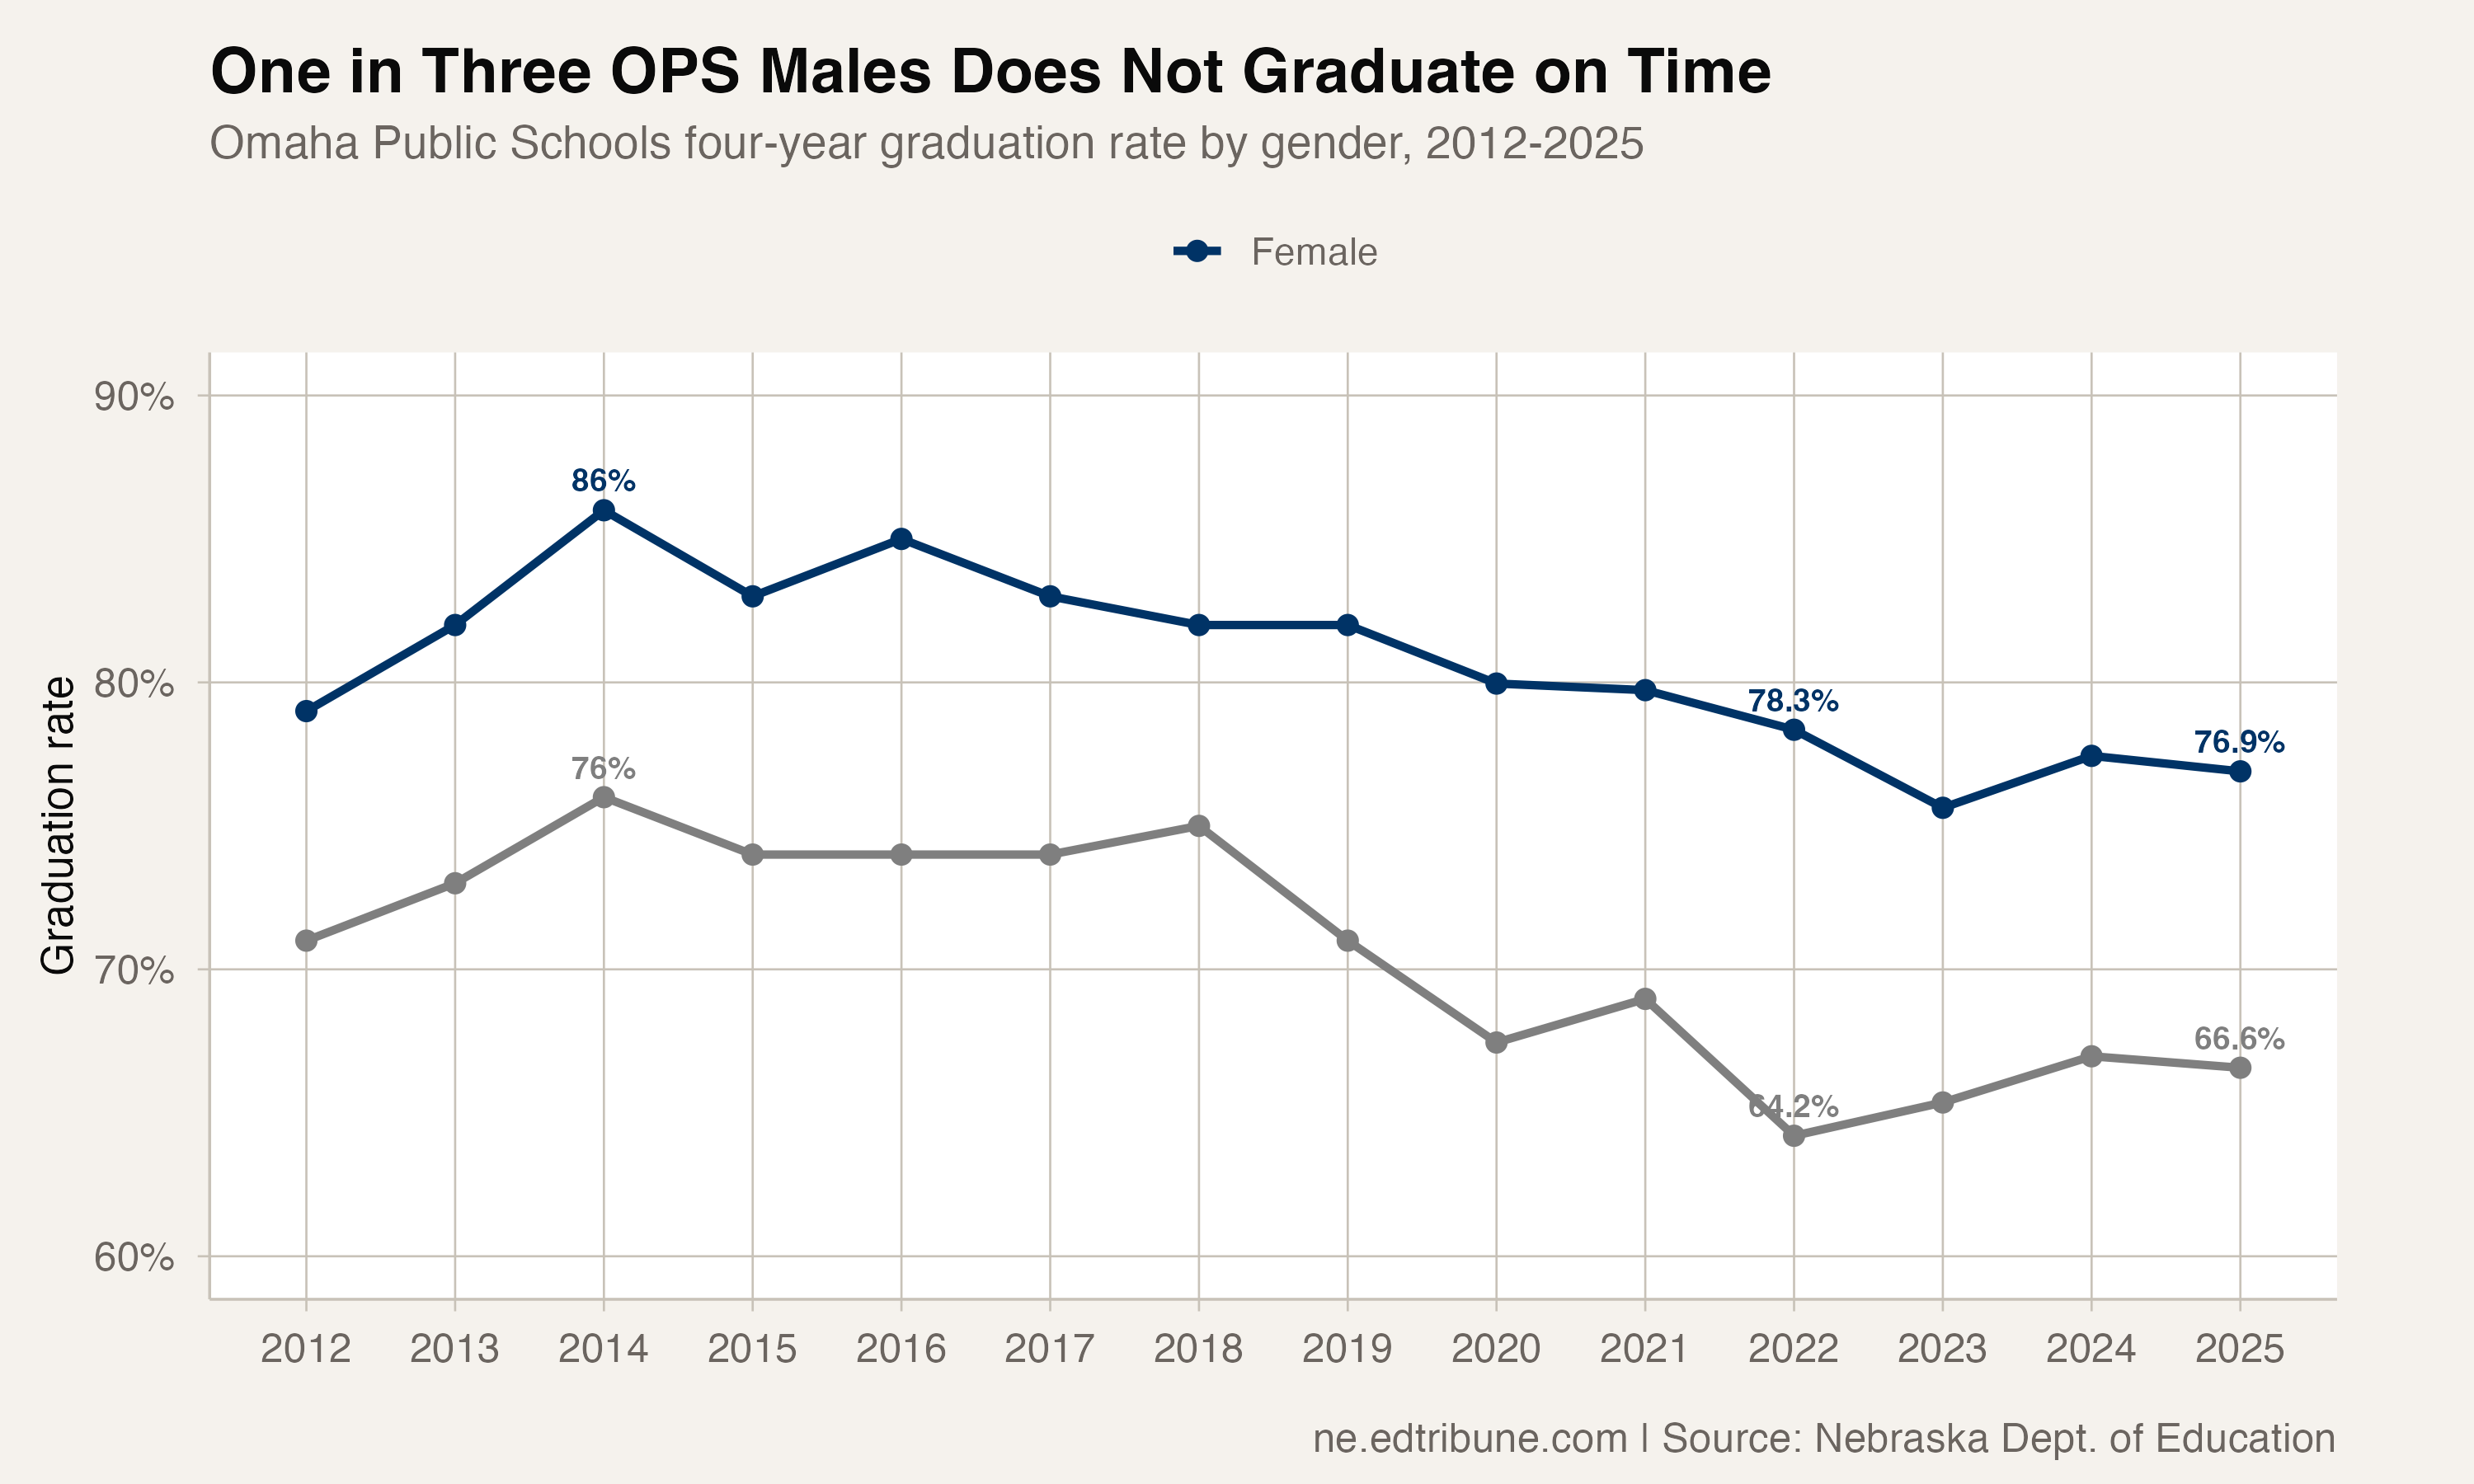
At Omaha Public Schools in 2025, the male graduation rate was 66.6%. Roughly one in three males in the four-year cohort did not earn a diploma on time.
The female rate was 76.9%. The 10.3 percentage point gender gap was more than double the statewide average of 4.3 points. And it was not new: the OPS male rate has been below 70% for every year from 2020 through 2025, the longest sustained period below that threshold in the 2012-2025 package record.
Six years below 70%
The OPS male graduation rate reached a 2012-2025 package-record high of 76.0% in 2014. It then stayed below that mark: 74.0% in 2016 and 2017, 75.0% in 2018, and 71.0% in 2019.
The male rate dropped to 67.5% in 2020 and has not recovered. The full trajectory since: 69.0% in 2021, 64.2% in 2022, 65.4% in 2023, 67.0% in 2024, and 66.6% in 2025. The 2022 value was the OPS male low in the 2012-2025 package record. Six consecutive years finished below 70%.
The female rate also declined, from 86.0% in 2014 to 76.9% in 2025. But females stayed above 75% in every year in the package record. The divergence between male and female trajectories at OPS is visible in the gap: every year from 2020 through 2025 was above 10 percentage points.
The numbers behind the rate
OPS enrolled 1,988 males in its 2025 graduation cohort. The package reports 1,324 male graduates, leaving 664 males who did not earn a diploma within four years.
For context, 664 male non-graduates is larger than the entire 2025 all-student graduation cohorts of 216 of Nebraska's 223 districts. It is also larger than Gretna Public Schools' 417-student cohort, male and female combined.
The female cohort of 1,817 produced 419 non-graduates at 76.9%. Combined across the male and female subgroup rows, OPS had 1,083 non-graduates in 2025. Males accounted for 61% of that total despite being 52% of the gender-counted cohort.
A gap unlike the state's
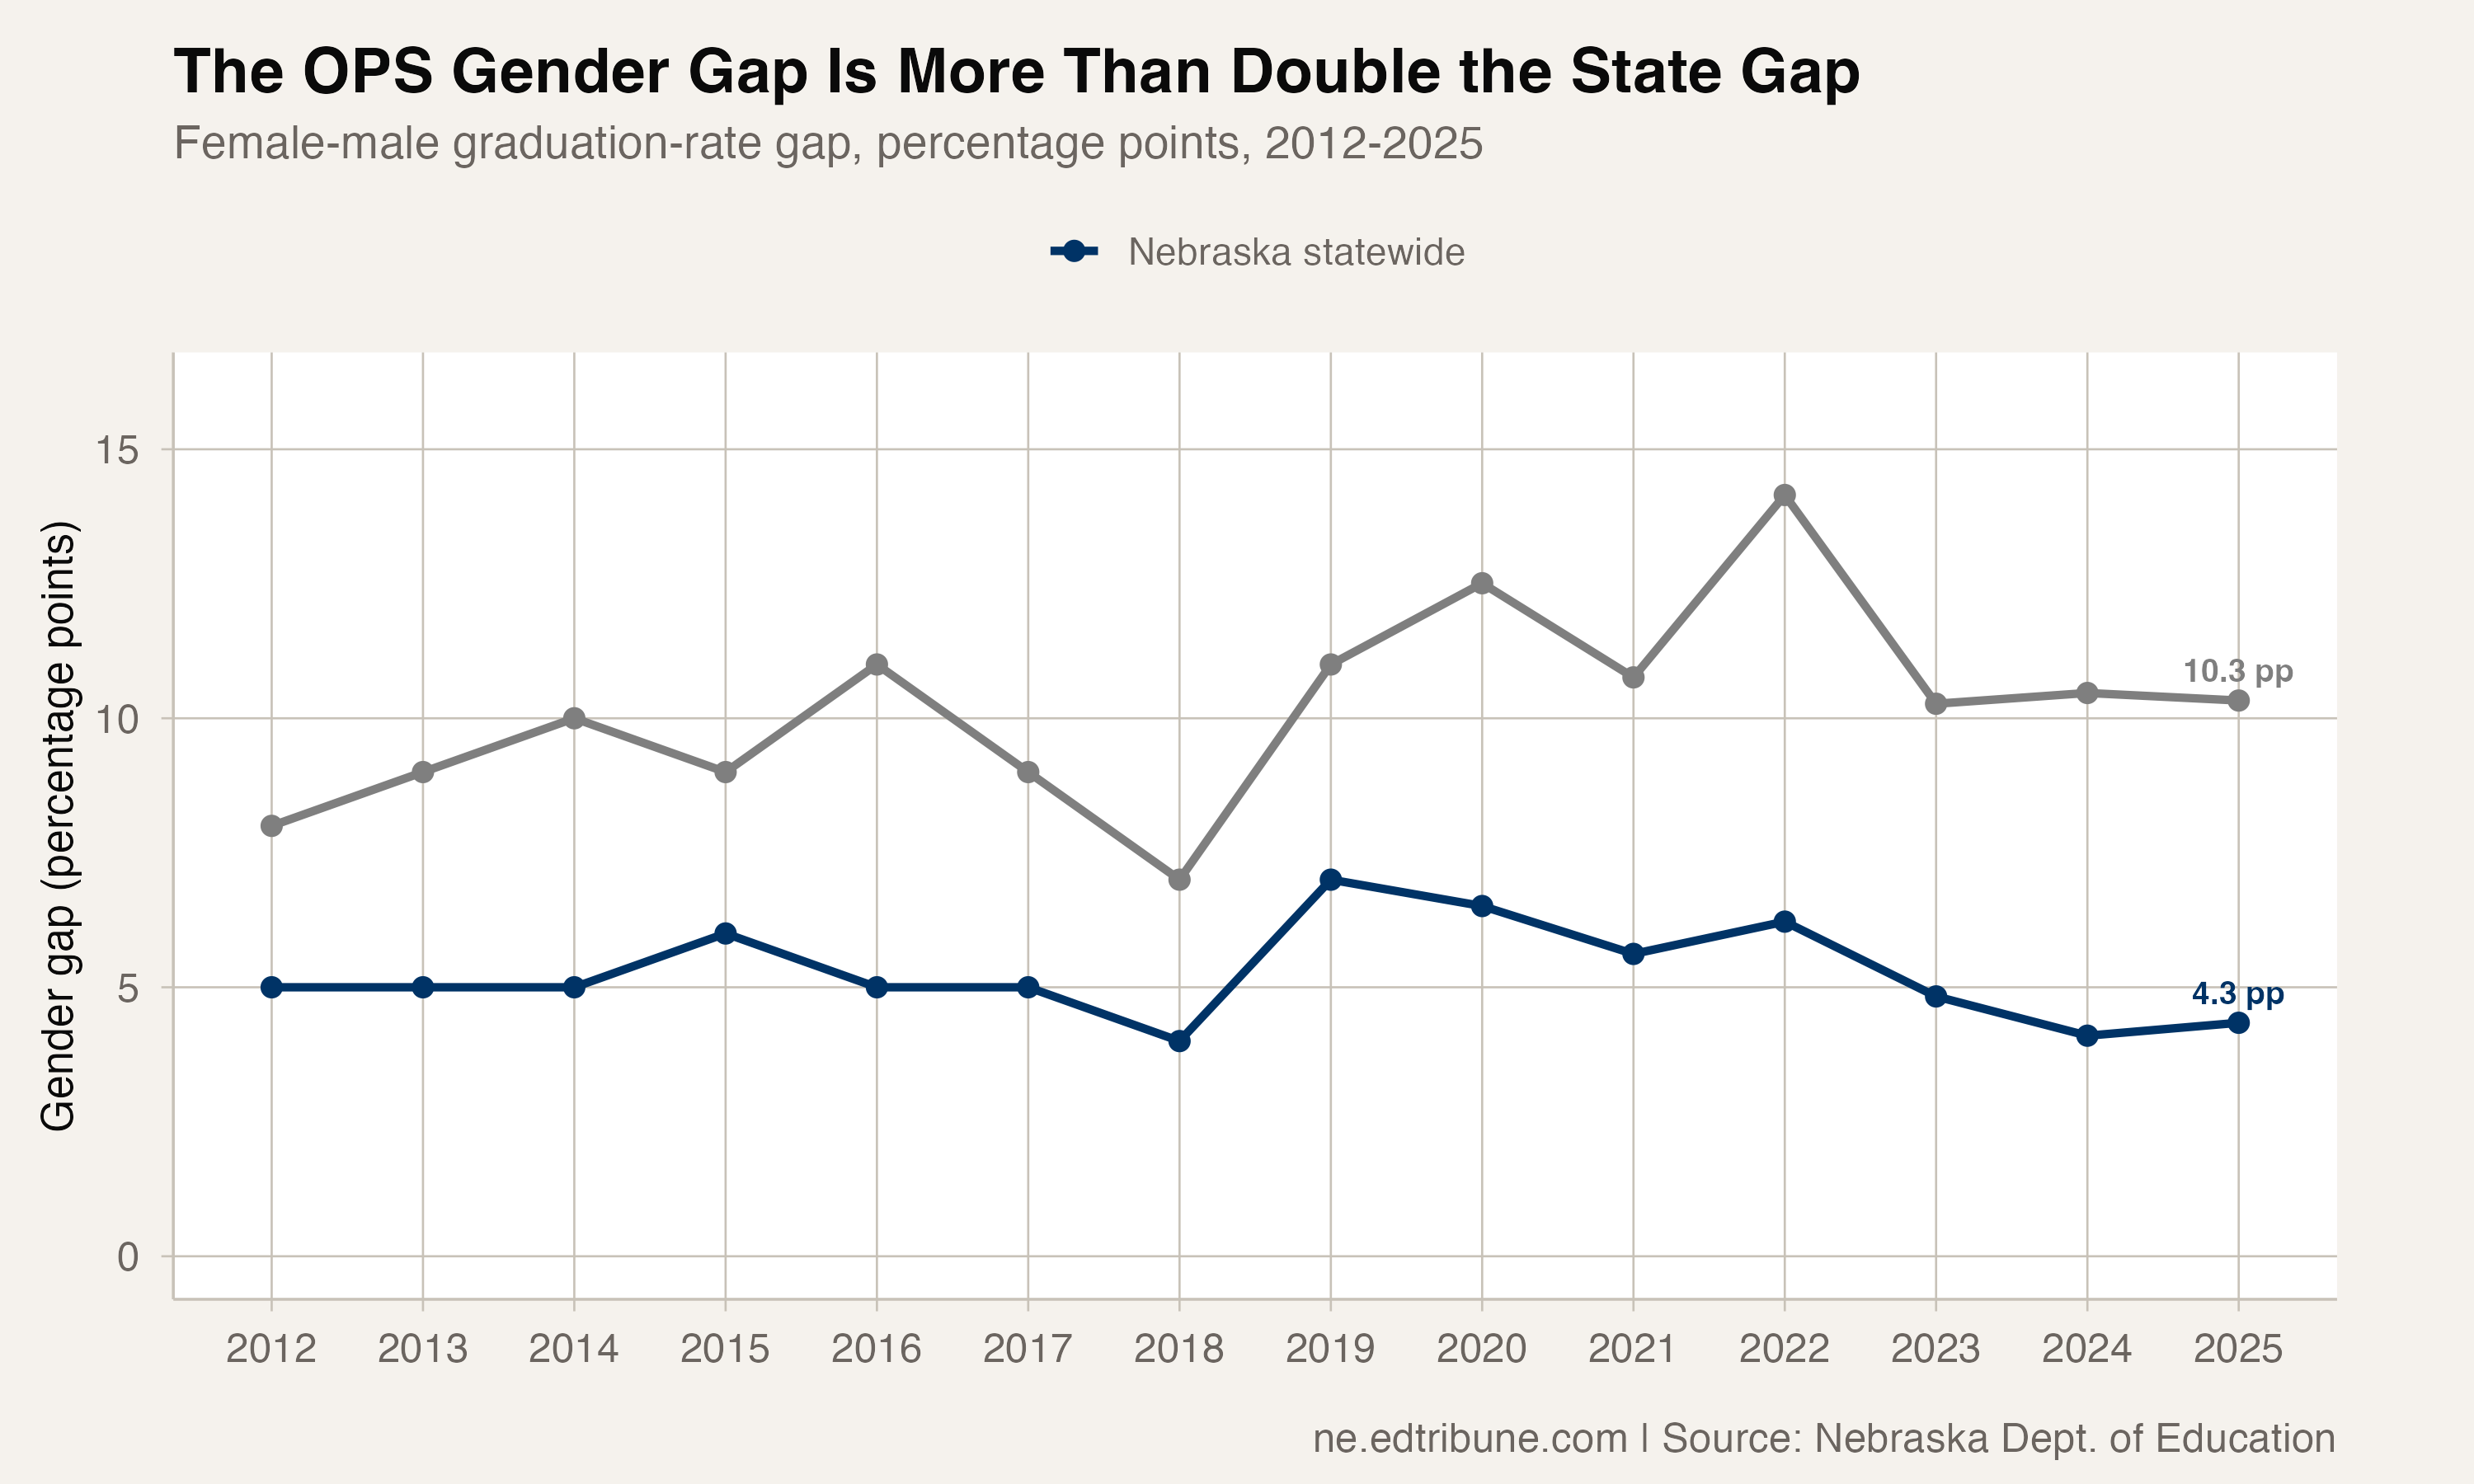
Statewide, the male-female graduation gap stayed between 4.0 and 7.0 percentage points for the entire 2012-2025 period. Males finished at 85.8% in 2025, females at 90.2%. The gap was 4.3 points.
The OPS gap operates in different territory. It exceeded 10 points in all six years from 2020 through 2025, peaking at 14.1 points in 2022. The 2025 gap of 10.3 points was 2.4 times the statewide average.
Among 130 Nebraska districts with male and female graduation rates in 2025, OPS ranked 12th by gender gap. The 11 districts with wider gaps all had much smaller male cohorts; OPS had the largest male cohort among the 12 districts with gaps at least as large as OPS.
Where the male non-graduates concentrate
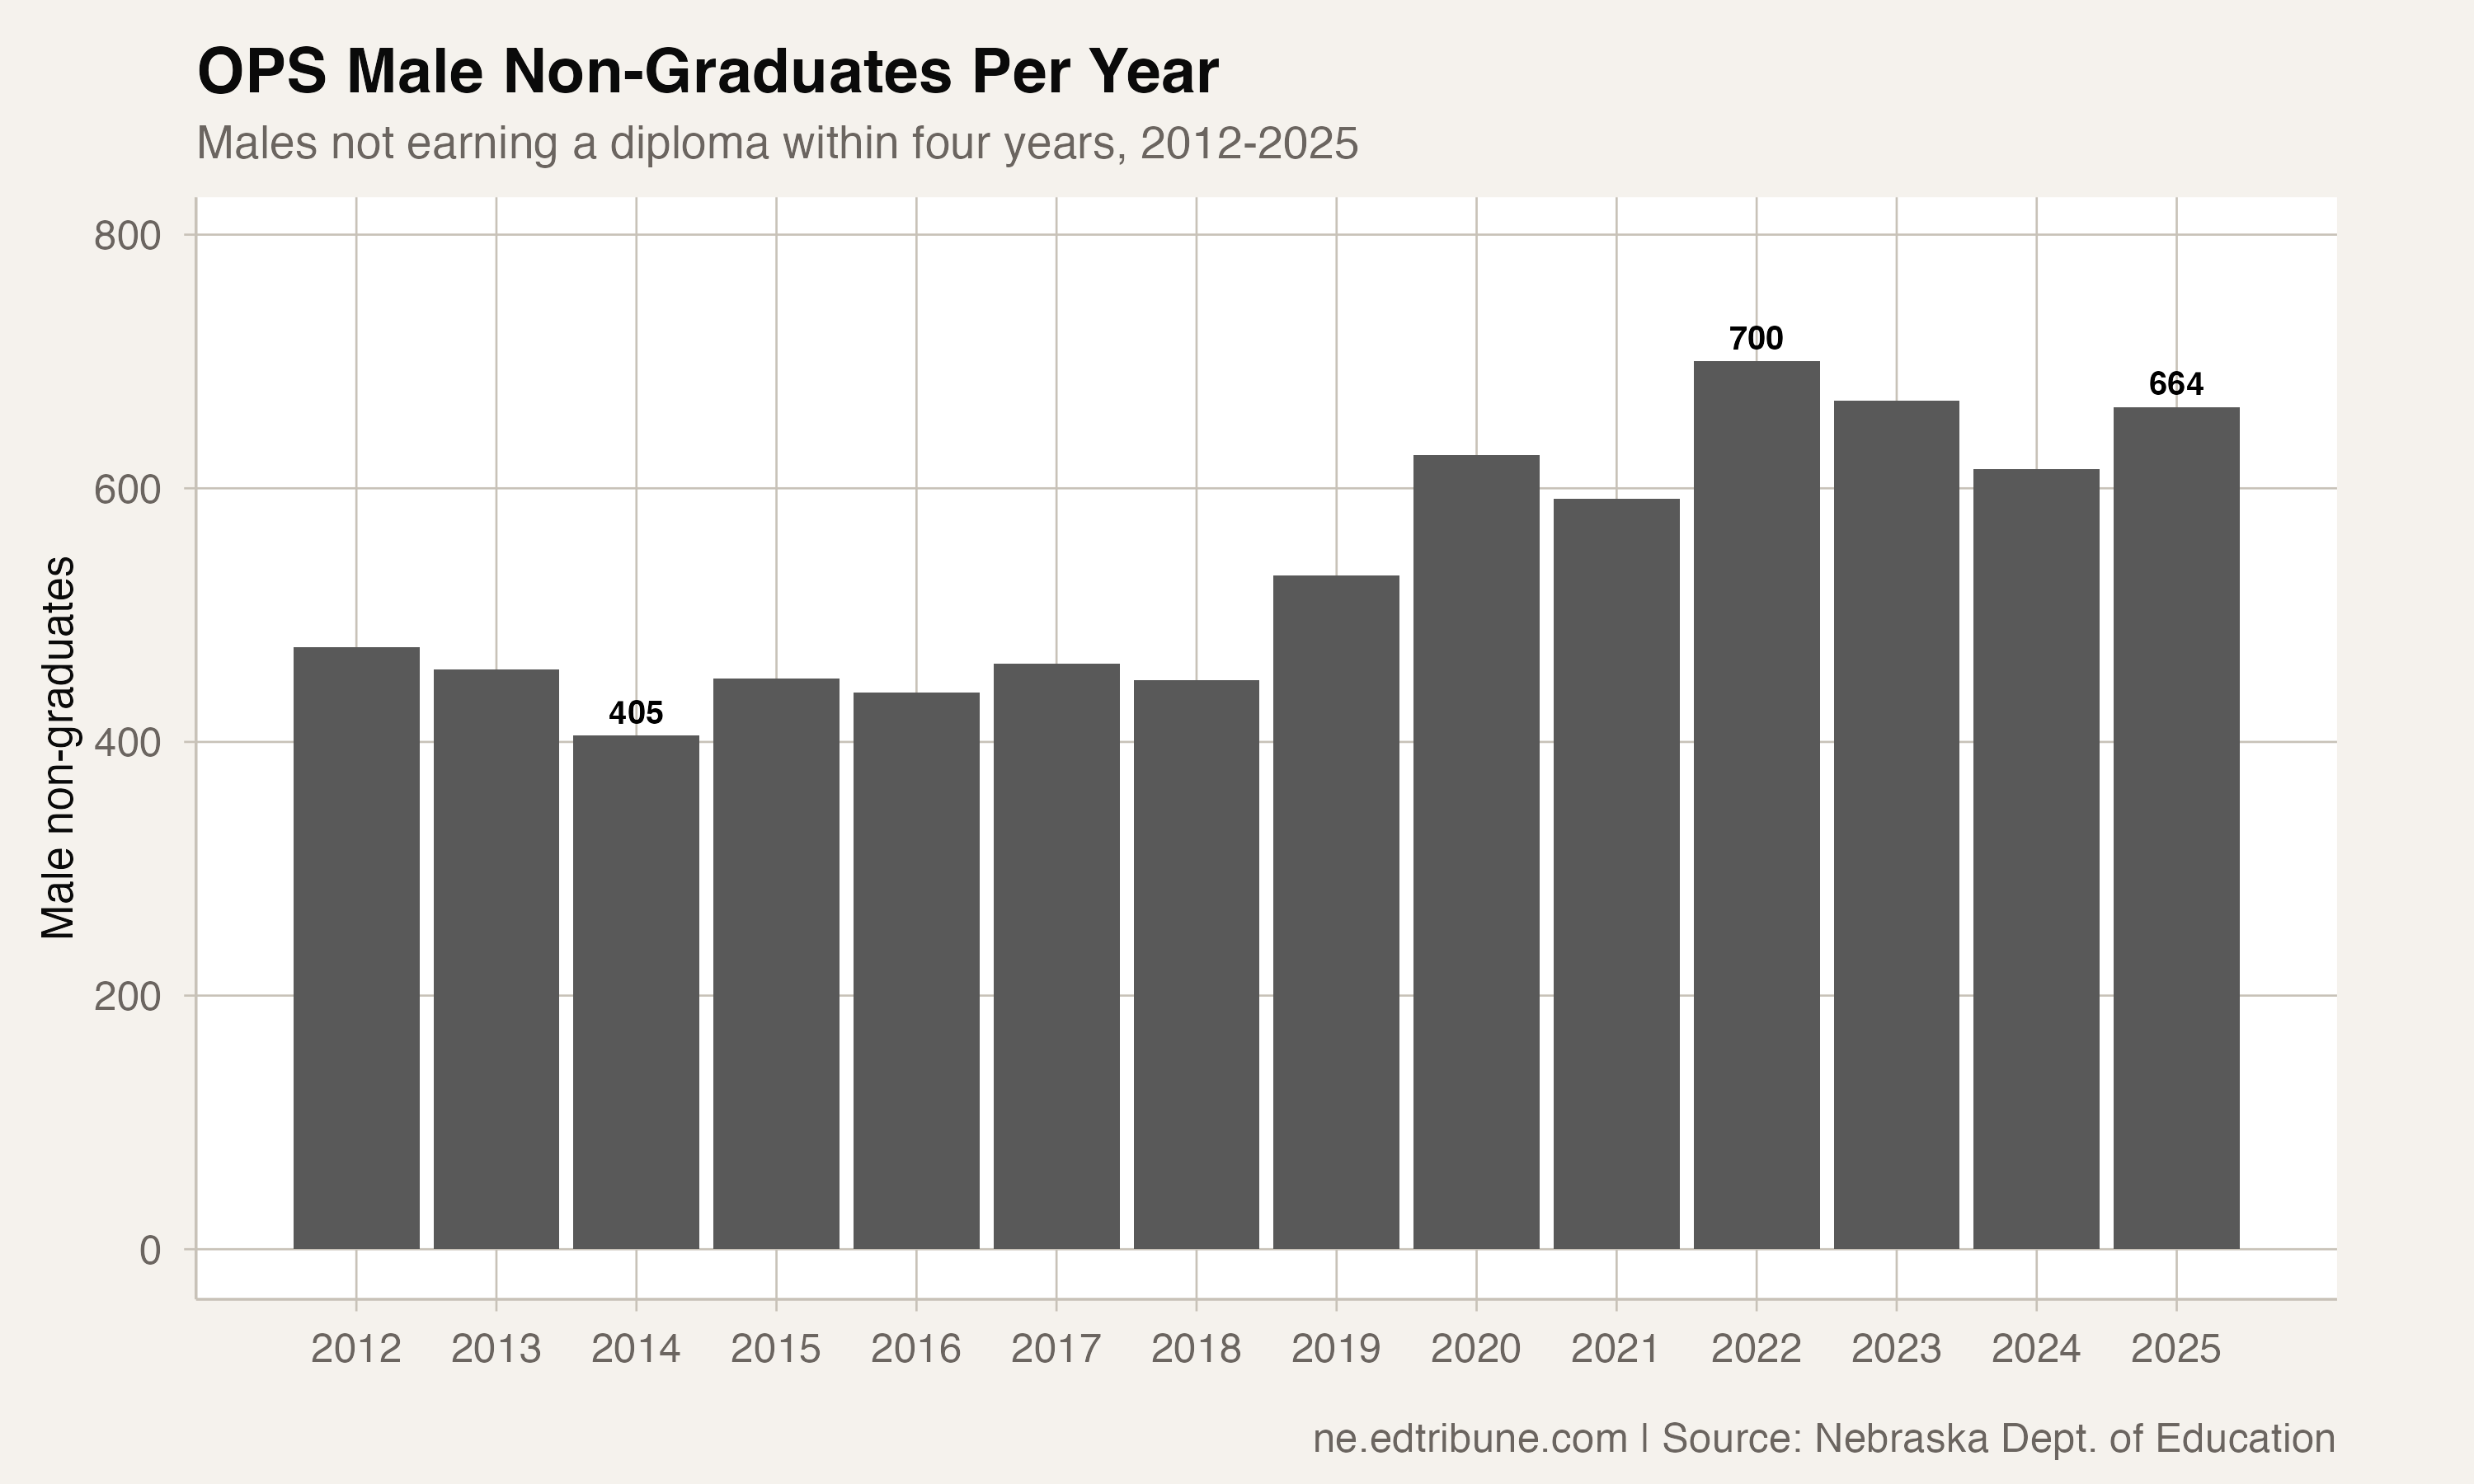
The male non-graduate count at OPS climbed from 405 in 2014 to 664 in 2025, a 64% increase. The male cohort grew from 1,690 to 1,988 over the same period, a 17.6% increase, so enrollment growth explains only part of the larger non-graduate count.
The worst male non-graduate count came in 2022, when 700 males did not graduate on time from a male cohort of 1,957.
OPS does not publish male-by-subgroup graduation cross-tabs in the package data, so the subgroup rates should not be read as male subgroup rates. The district-wide data still shows the broader graduation floor around the same students: LEP students at 39.7%, students identified as homeless at 48.1%, and special education students at 54.1%.
What the gender gap can and cannot prove
The graduation file verifies outcomes, not causes. It shows that OPS males finished 10.3 points below OPS females in 2025, while Nebraska males finished 4.3 points below Nebraska females statewide.
Confidence label: direct evidence for the rates, counts, ranks, and comparisons above; suggestive context for interpreting the gap as a district-level warning, because the graduation data does not identify the mechanisms behind the gap.
The statewide gender gap is a demographic characteristic. The OPS gender gap is a district-level crisis.
Detailed code that reproduces the analysis and figures in this article is available exclusively to EdTribune subscribers.
Discussion
Sign in to join the discussion.
Loading comments...