Correction (July 21, 2026): A July 3 fact-check corrected several homeless-student rates, three 2025 subgroup rates, the subgroup-ladder span, and the foster-care non-graduate count but did not add the required visible notice. This audit also removes explanations for subgroup and district differences that the aggregate graduation file cannot test, including an unsupported claim about students who are both Hispanic and English learners. The verified rates and counts below come from current package output.
Below Nebraska's 87.9% statewide graduation rate sit three reported subgroups: foster care youth, English learners, and students who are currently homeless.
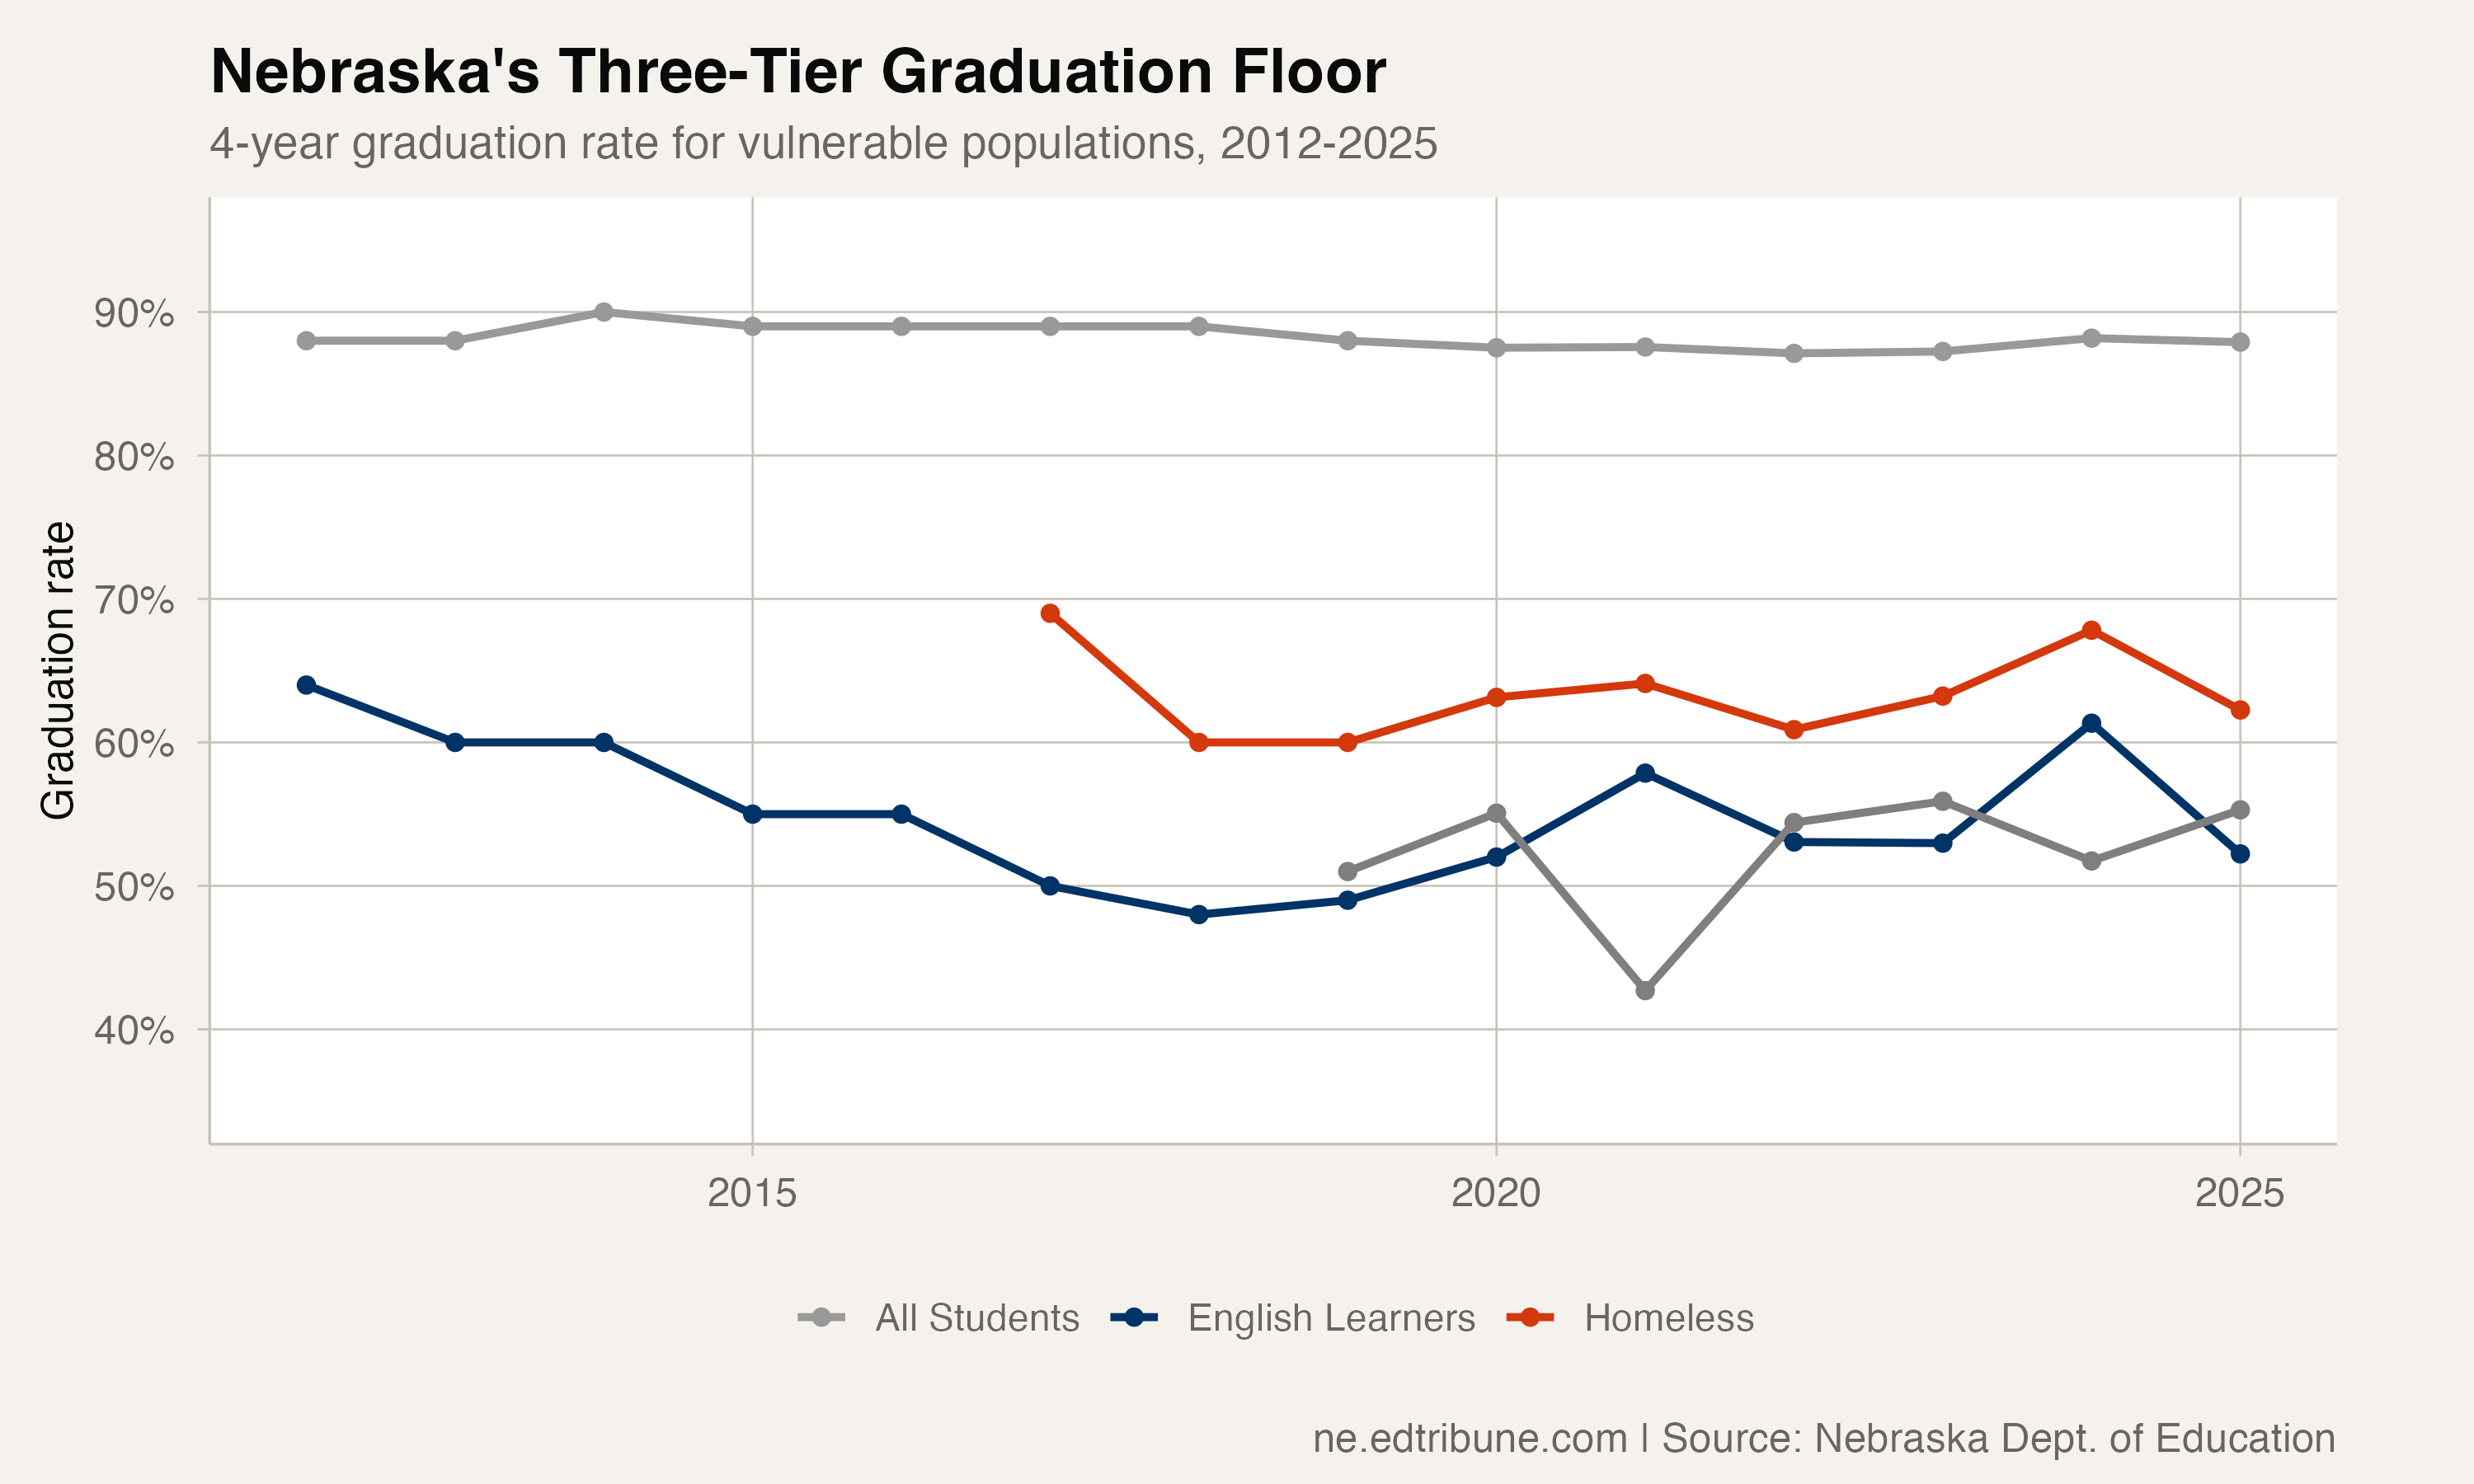
In 2025, the rates were: English learners at 52.2%. Foster care youth at 55.3%. Students who are currently homeless at 62.3%. These are not small cohorts at the margins of the data. The LEP cohort alone is 1,882 students. Foster care accounts for 216. Students who are currently homeless add hundreds more.
Together, these groups form a tiered floor — each level below the next, all of them 26 to 36 percentage points below the state average.
The foster care plateau
Foster care is the smallest of the three populations, with 216 students in the 2025 cohort. Its seven-year series is volatile rather than monotonic, ranging from 42.7% to 55.9%.
The 2021 rate of 42.7% was the low. The 2023 rate of 55.9% was the high. The seven-year mean was 52.3%, and the 2025 rate was 55.3%.
At the 2025 cohort size, one student represents about 0.5 percentage point. The reported rate was 51.0% when the subgroup series began in 2019 and 55.3% in 2025; the intervening years moved in both directions.
The aggregate file contains no placement histories, school-transfer records, transcripts or credit records. It cannot identify why the foster-care rate changed or connect a particular mechanism to the statewide series.
The LEP decline
The LEP graduation rate fell from 64% in 2012 to 52.2% in 2025, a decline of nearly 12 percentage points over 14 years. The cohort more than doubled from 884 to 1,882 students, while the reported non-graduate count rose from 318 to 899, nearly tripling.
Among these three series, LEP combines the largest endpoint decline with the largest 2025 cohort.
The rate rose to 61.3% in 2024, then fell to 52.2% in 2025 as the reported cohort grew 48.3%. The aggregate file does not establish whether classification, methodology, population change or outcomes contributed to the year-to-year movement.
The homeless decline
Students who are currently homeless have seen a gradual decline from 69% in 2017 to 62.3% in 2025. The trend has been inconsistent: 63.1% in 2020, 64.1% in 2021, 60.9% in 2022, then a bounce to 67.8% in 2024 before falling again.
The federal McKinney-Vento definition includes students living in shelters, motels, cars, or doubled up with other families because of housing loss or economic hardship. Nebraska's aggregate graduation file does not connect those housing circumstances to individual outcomes.
What happens at OPS
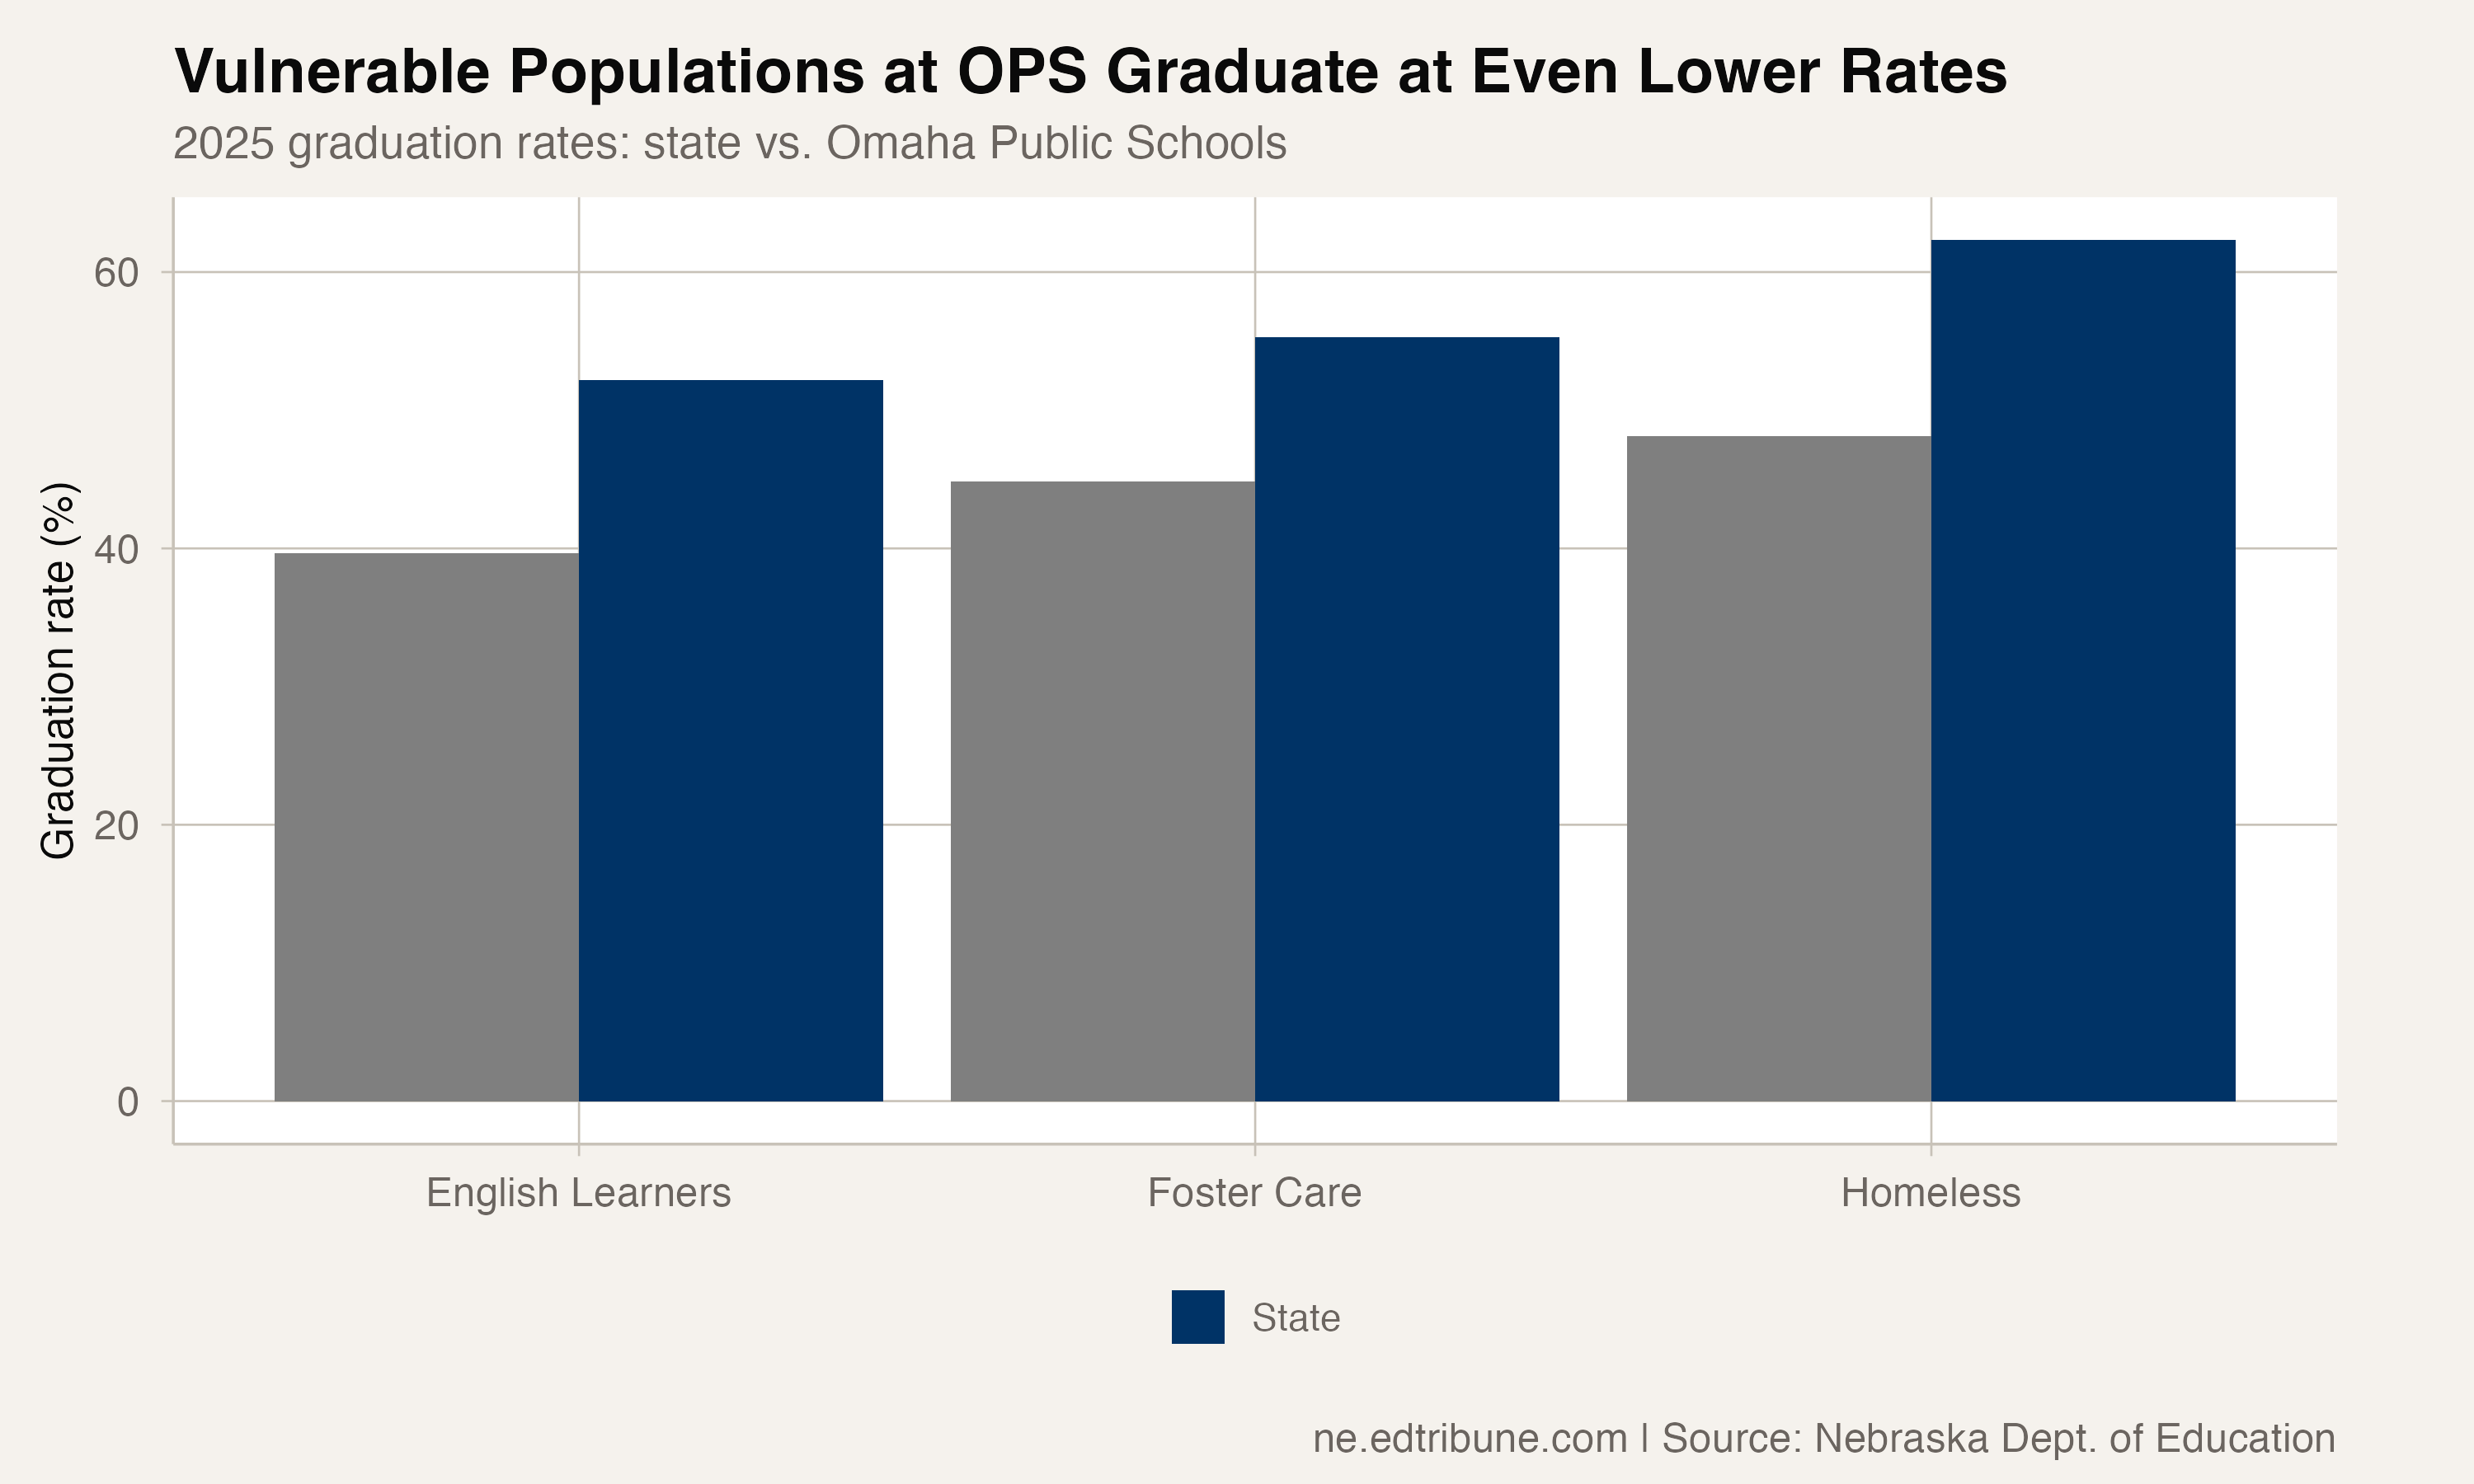
The statewide rates for these populations are already low. At Omaha Public Schools, they are worse. In 2025, OPS graduated LEP students at 39.7% (711 students), foster care youth at 44.8% (86 students), and students who are currently homeless at 48.2% (53 students).
The gaps between state and OPS rates were 12.5 points for LEP, 10.5 points for foster care and 14.1 points for homeless. The overall OPS-to-state gap was 16.4 points.
OPS reported a 39.7% LEP graduation rate, compared with 79.7% at Lexington and 81.4% at Schuyler. These are aggregate district rates, not individual probabilities. The package does not hold student profiles constant or identify what caused the differences.
The graduation rate ladder
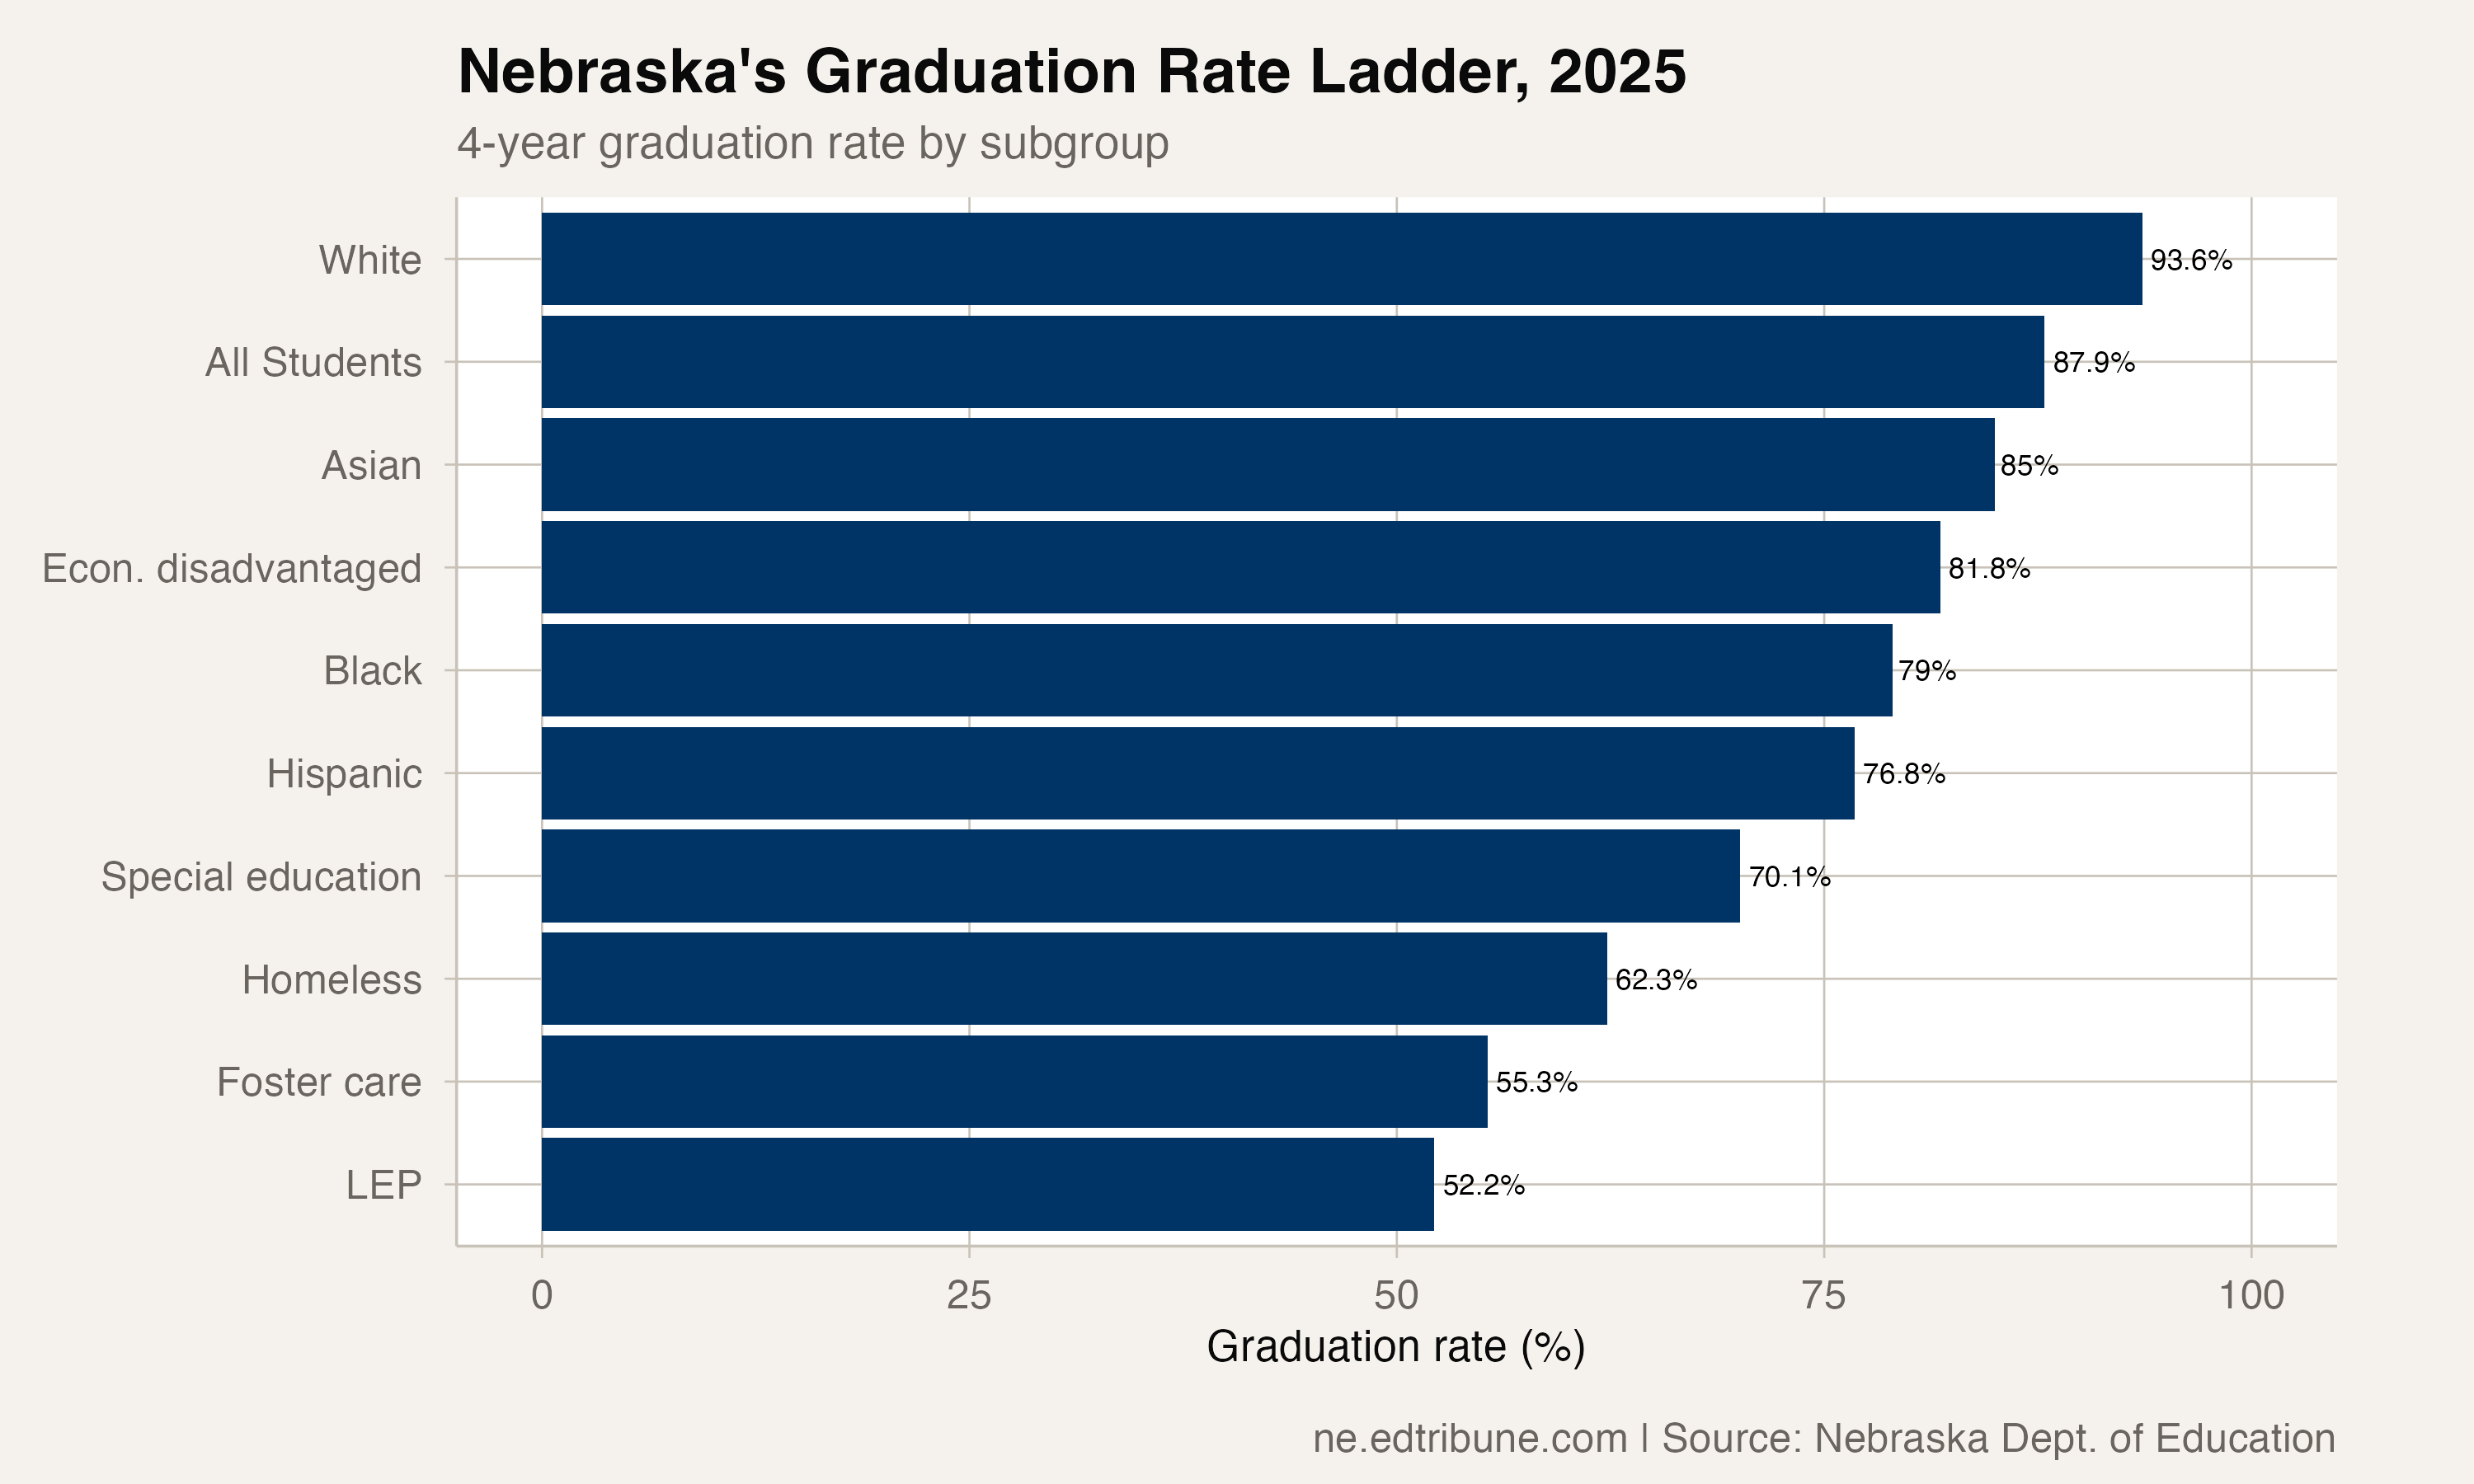
Nebraska's full subgroup breakdown in 2025 forms a ladder with 41 percentage points between the top and bottom rungs. White students at 93.6%. The statewide average at 87.9%. Asian students at 85.0%. Economically disadvantaged students at 81.8%. Black students at 79.0%. Hispanic students at 76.8%. Special education at 70.1%.
Then the floor: homeless at 62.3%, foster care at 55.3%, and LEP at 52.2%.
The gap from white to Hispanic was 16.8 points. The difference between the separately reported Hispanic and LEP rates was another 24.6 points. These categories can overlap, and the package does not publish a Hispanic-and-LEP cross-tab, so the two gaps cannot be added to describe an individual student's outcome.
What four years cannot capture
The Nebraska package reports only the four-year adjusted cohort graduation rate. It does not publish later outcomes for these cohorts.
That absence makes it impossible to determine from this file how many of the 899 LEP non-graduates or 96 foster-care non-graduates eventually earned diplomas.
The verified pattern is narrower: the foster-care series averaged 52.3%; the LEP rate fell from 64.0% to 52.2%; and the homeless-student rate fell from 69.0% to 62.3%. Those figures describe the reported four-year outcomes, not their causes or what happened after the four-year window.
Detailed code that reproduces the analysis and figures in this article is available exclusively to EdTribune subscribers.
Discussion
Sign in to join the discussion.
Loading comments...