Ralston Public Schools is an enclave. The district is surrounded entirely by Omaha — a small community of roughly 267 seniors that occupies its own geographic and administrative island within the metro area.
In 2018, Ralston graduated 90% of its students. It was solidly in the suburban tier, closer to Millard and Papillion-La Vista than to OPS. Seven years later, the rate is 76.9%.
The 13.1 percentage point decline has been nearly invisible in the state's graduation data. Ralston is small enough that its numbers rarely make headlines. But the trajectory — from 90% to 77% — represents one of the steepest sustained declines among Nebraska districts with meaningful cohort sizes.
The convergence
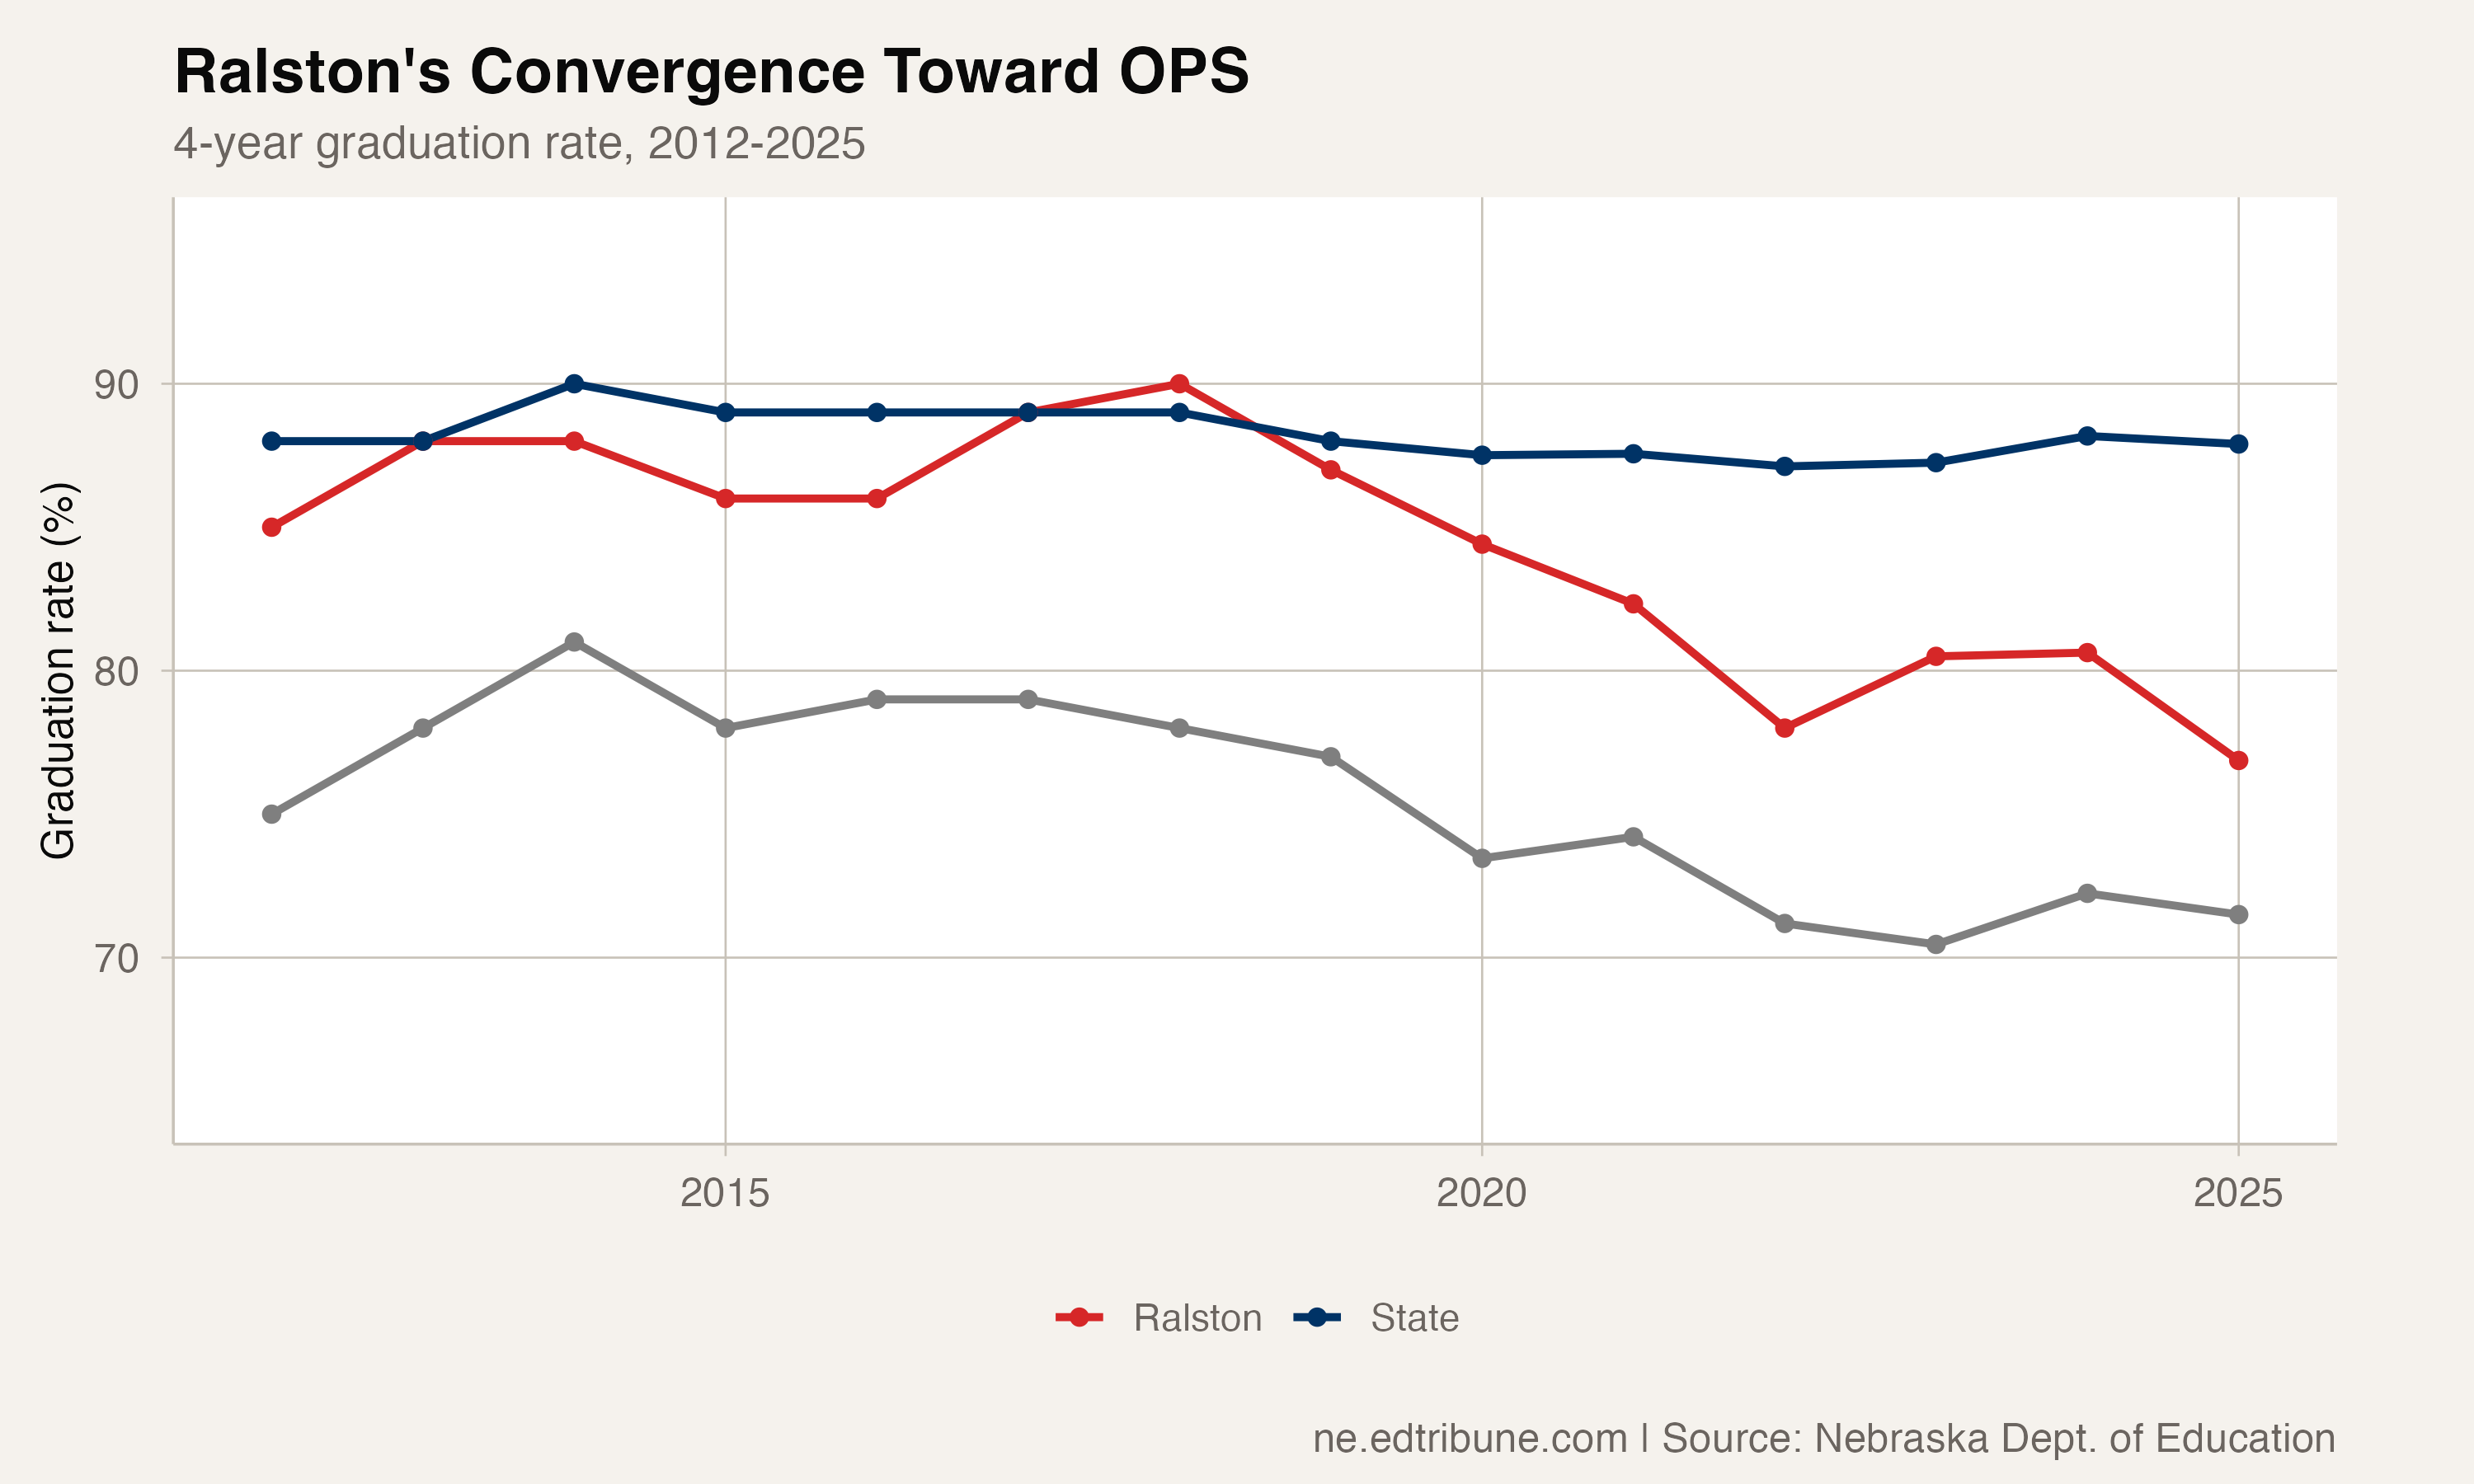
The chart tells the story. Ralston's graduation rate line, which in 2018 ran parallel to the state average, has been descending toward the OPS line for seven years. In 2018, Ralston was 12 points above OPS. In 2025, the gap is 5.4 points.
The trajectory: 90% in 2018, 87% in 2019, 84.4% in 2020, 82.3% in 2021, 78% in 2022, 80.5% in 2023, 80.6% in 2024, 76.9% in 2025. The rate declined in six of seven years, with only a brief plateau in 2023-2024 before the sharpest single-year drop.
At 76.9%, Ralston is now 11 points below the state average. It sits in a statistical no-man's land — no longer suburban in its graduation outcomes, not yet at OPS levels, but drifting in that direction.
Inside the numbers
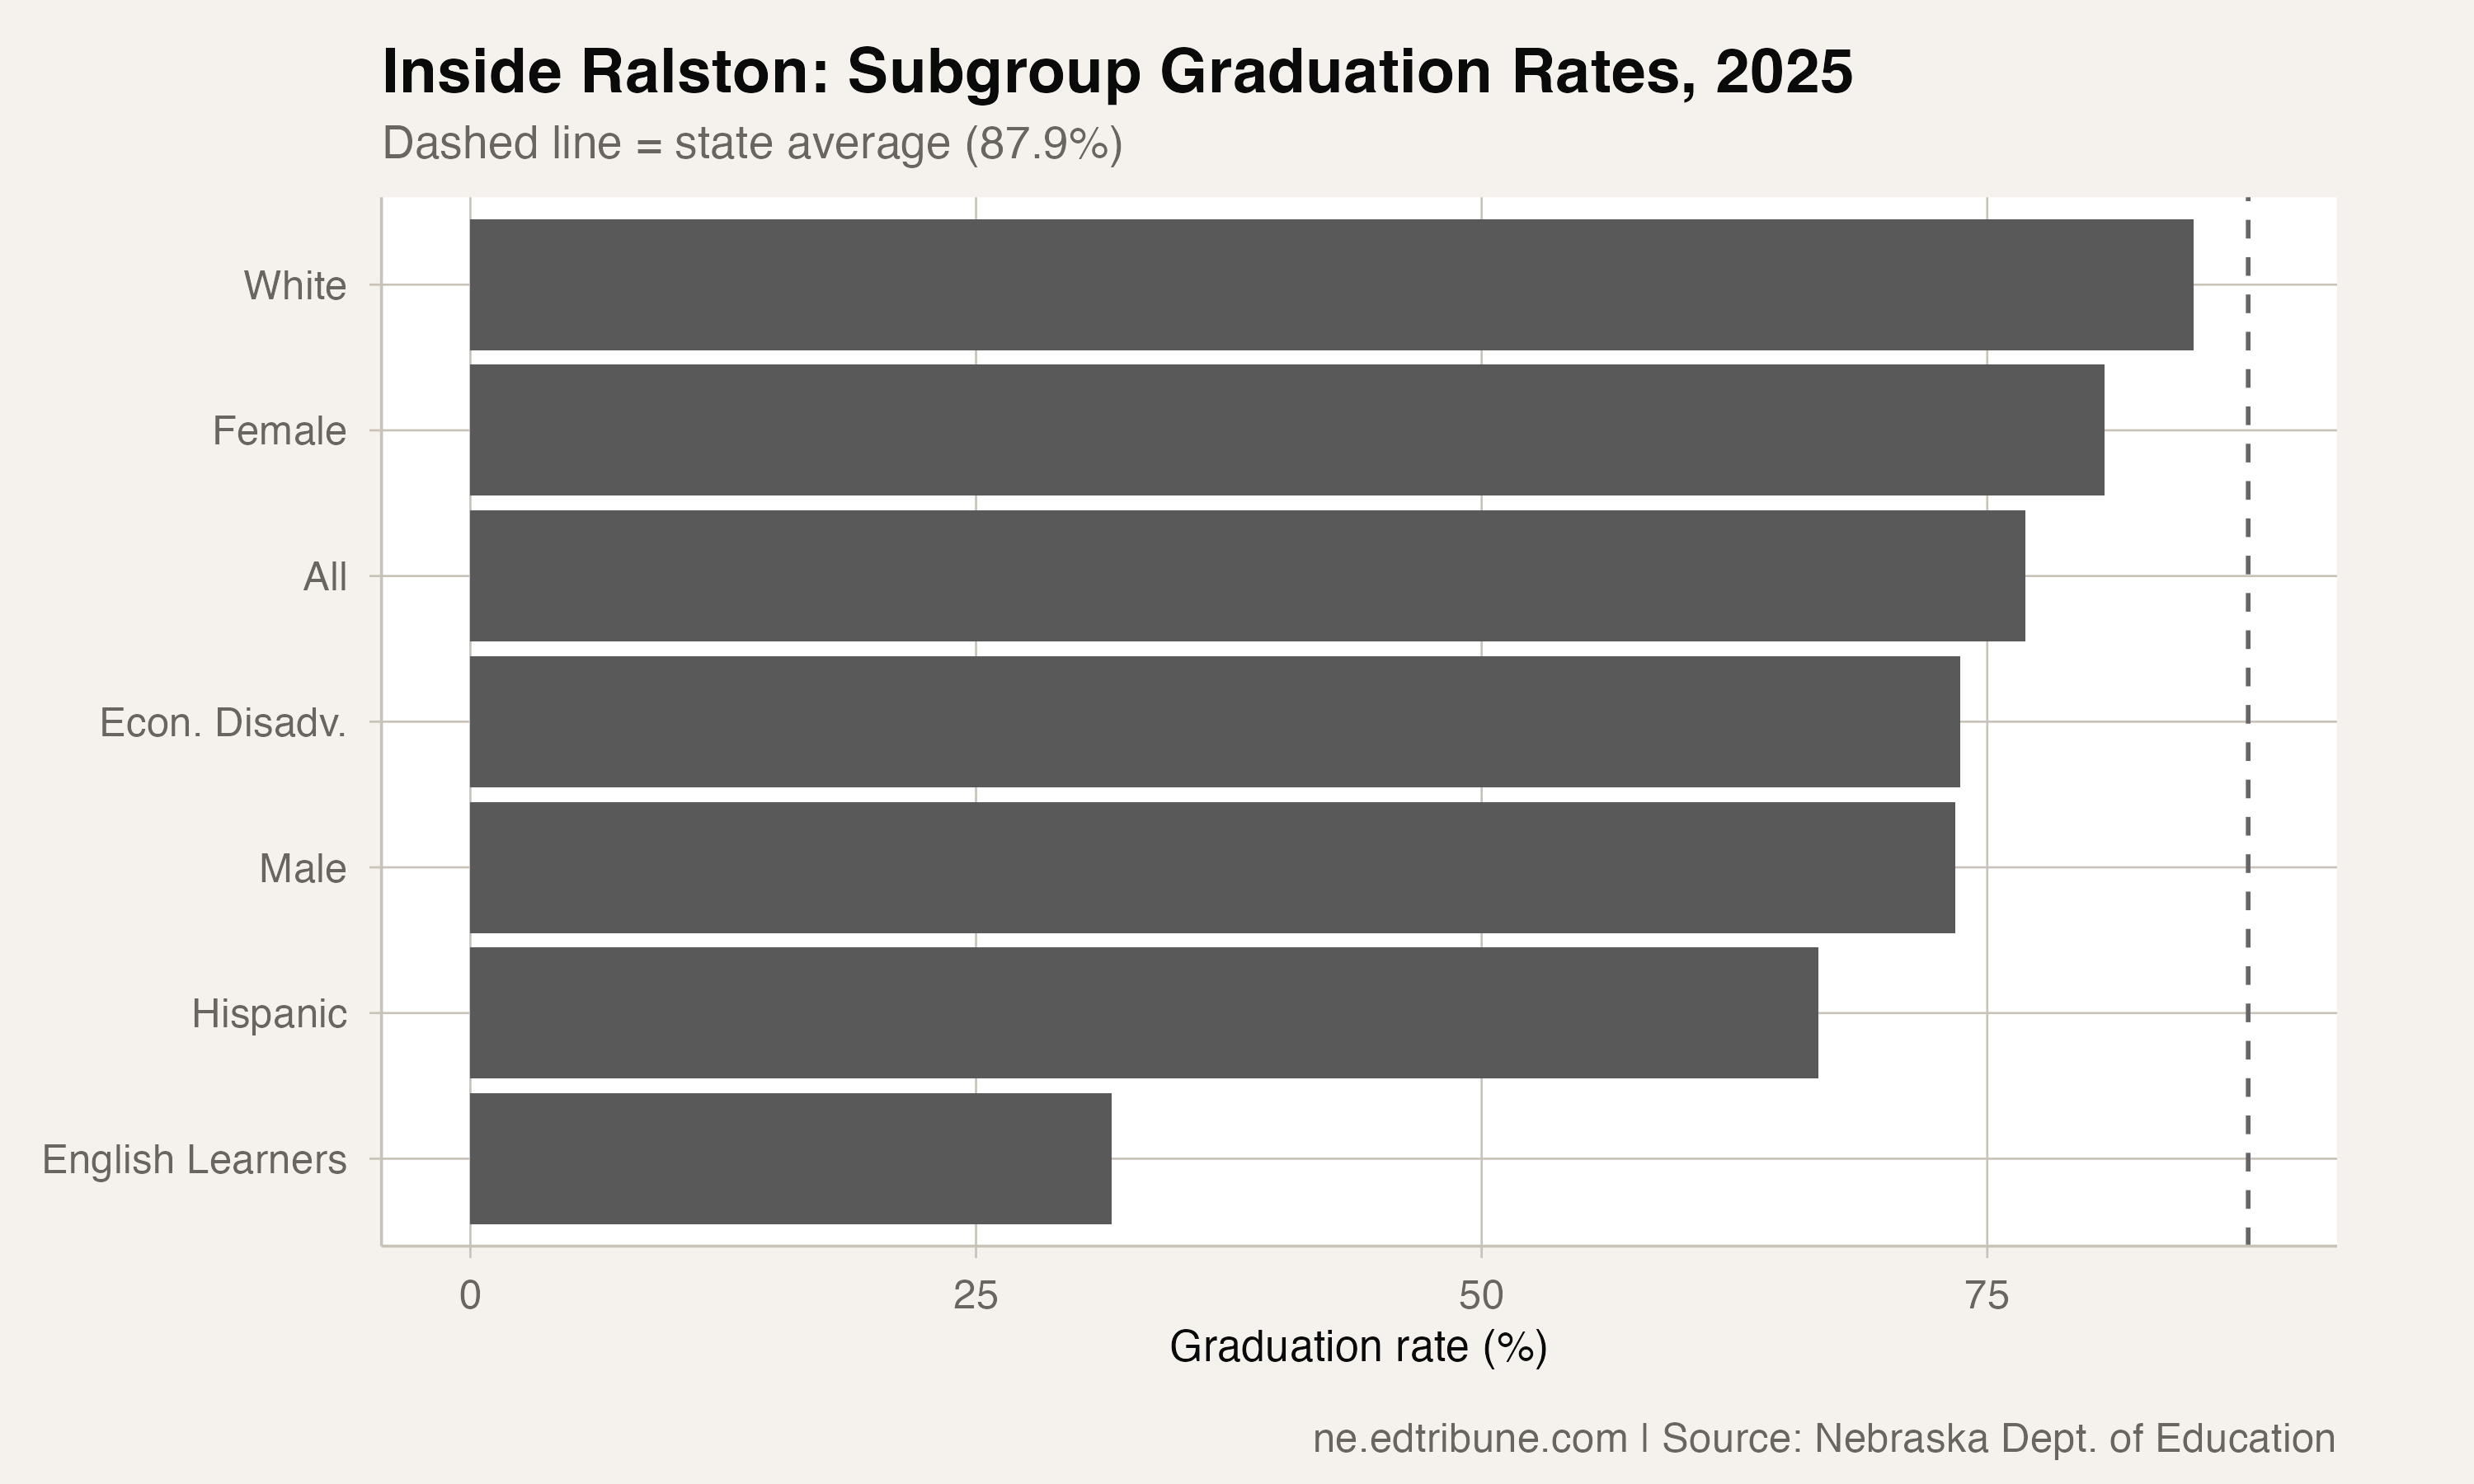
Ralston's subgroup data in 2025 reveals where the decline is concentrated. English learners graduated at 31.7% — the lowest LEP rate of any reporting district in Nebraska. Hispanic students posted 66.7%. Economically disadvantaged students finished at 73.7%.
White students graduated at 85.2%, closer to the state average but still below it. Males posted 73.4% while females hit 80.8%, producing a 7.4-point gender gap.
The LEP figure is the most striking. Ralston's 40 English learners graduated at a rate 20 points below the statewide LEP average of 52.2% and 8 points below the OPS LEP rate of 39.7%. For a district of Ralston's size, 40 LEP students represents a significant share of the cohort — roughly 15% — and the 31.7% rate drags the overall average substantially.
What changed
Ralston's demographic composition has shifted in recent years. The district has absorbed a growing proportion of English learners and economically disadvantaged students, a pattern consistent with the broader demographic change in the Omaha metro area.
The question is whether the decline reflects the district struggling to serve a changing student body, or whether it reflects something more specific — staffing changes, resource constraints, program cuts, or other factors that would not show up in graduation rate data alone.
The 267-student cohort is small enough that 10 additional non-graduates shift the rate by nearly 4 percentage points. The 2025 drop from 80.6% to 76.9% represents roughly 10 fewer graduates compared to what the 2024 rate would have predicted. Small margins, large rate movements.
The enclave effect
Ralston's geography is its defining characteristic. The district draws from a compact area surrounded by OPS on every border. Families living in Ralston who want a different educational option have few choices: OPS (which graduates at 71.5%), private schools, or moving to a different suburb.
The enclave creates a dynamic where Ralston cannot easily draw students from beyond its boundaries and cannot easily lose students to adjacent public options. The district's population is, in effect, fixed by geography. As the demographic composition of that geographic area changes, the district's student body changes with it.
Other suburban Omaha districts have experienced some of the same demographic shifts but from a position of greater size and resources. Millard serves 1,762 seniors and graduates at 92.6%. Papillion-La Vista serves 908 and graduates at 96.2%. These districts have the scale to absorb demographic change while maintaining high graduation rates. Ralston, with 267 seniors, does not have the same buffer.
The trajectory question
If Ralston's rate continues to decline at its current pace — roughly 2 points per year since 2018 — it would converge with OPS within three to four years. Whether that happens depends on factors the graduation rate data alone cannot predict.
What the data does show is that Ralston has moved from the suburban tier to somewhere in between, and that the movement has been sustained across seven years. The 2023-2024 plateau offered a brief hope of stabilization. The 2025 drop to 76.9% eliminated that hope.
Detailed code that reproduces the analysis and figures in this article is available exclusively to EdTribune subscribers.
Discussion
Sign in to join the discussion.
Loading comments...