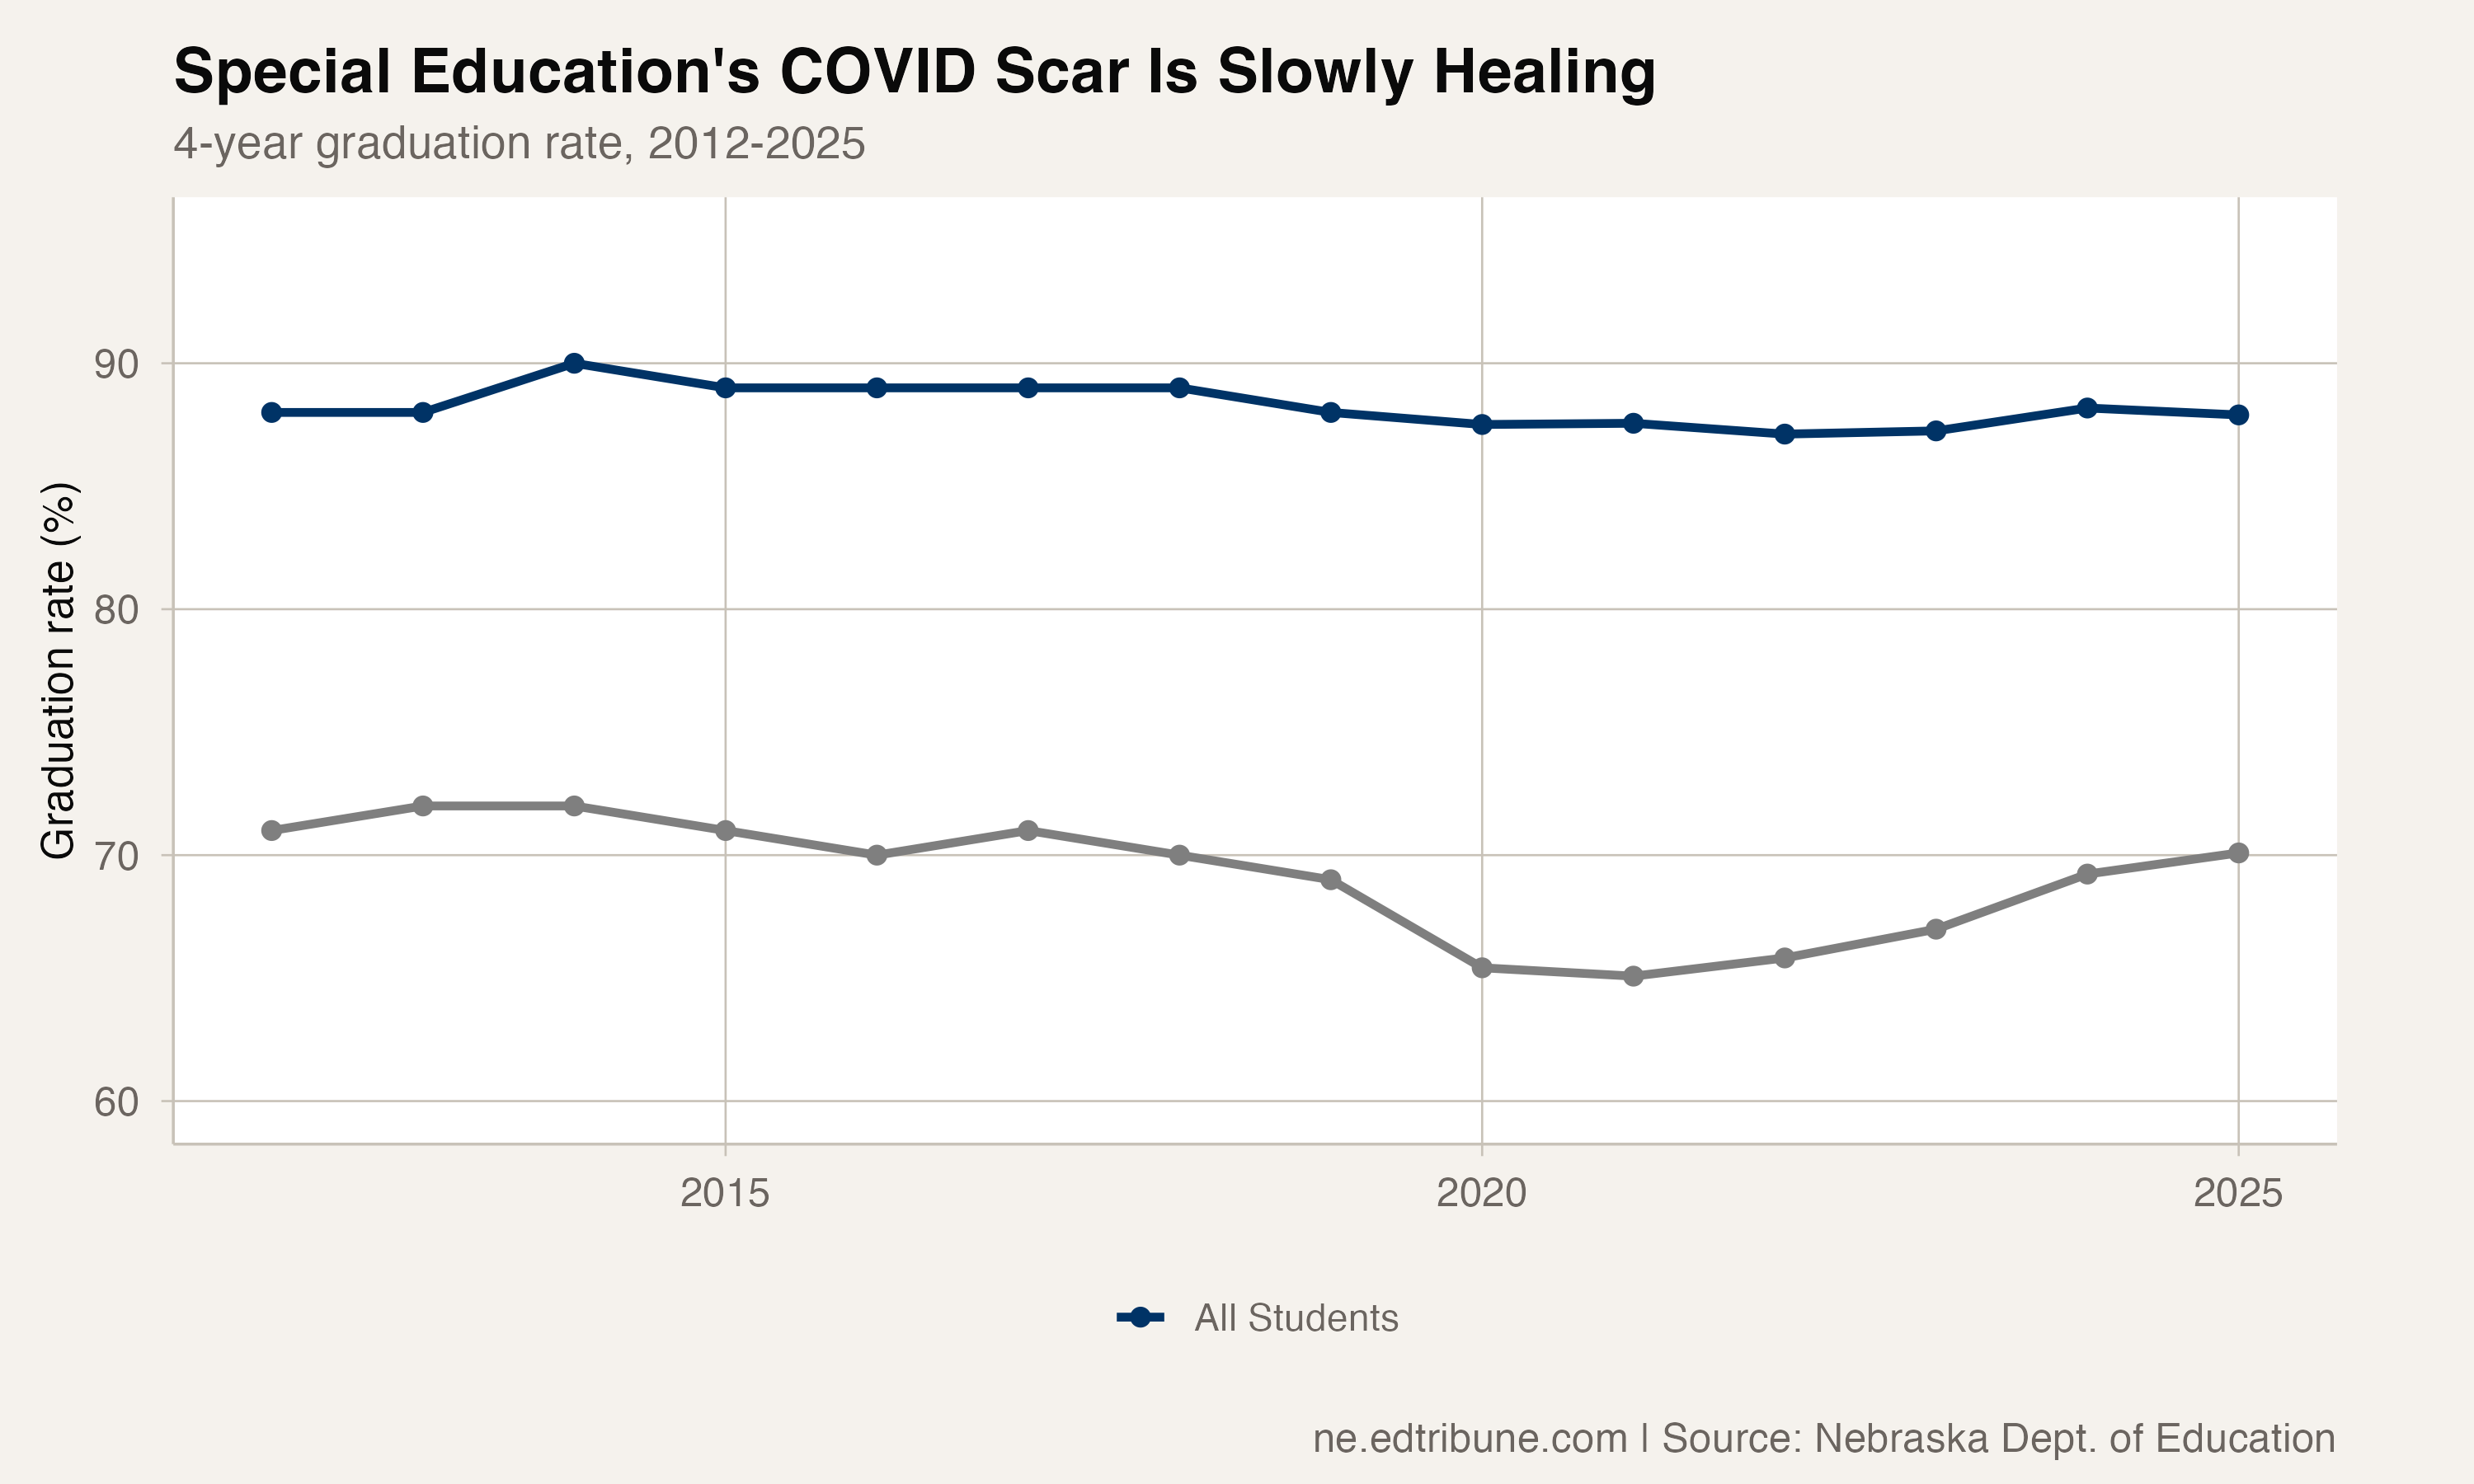
Of all the graduation rate gaps in Nebraska's data, the one involving students with disabilities followed the most textbook COVID arc: a sharp decline, a gradual recovery, and the lingering question of whether the scar tissue will ever fully heal.
Before the pandemic, Nebraska's special education graduation rate stood at 69% in 2019, with a 19-point gap to the state average of 88%. By 2021, the rate had fallen to 65.1% and the gap had swollen to 22.5 points — the widest SpEd-to-state gap in the 14 years of available data.
The recovery has been slow. Year by year: 65.8% in 2022. 67.0% in 2023. 69.2% in 2024. 70.1% in 2025. Five years after the trough, the rate has barely cleared its pre-COVID level.
The gap that expanded
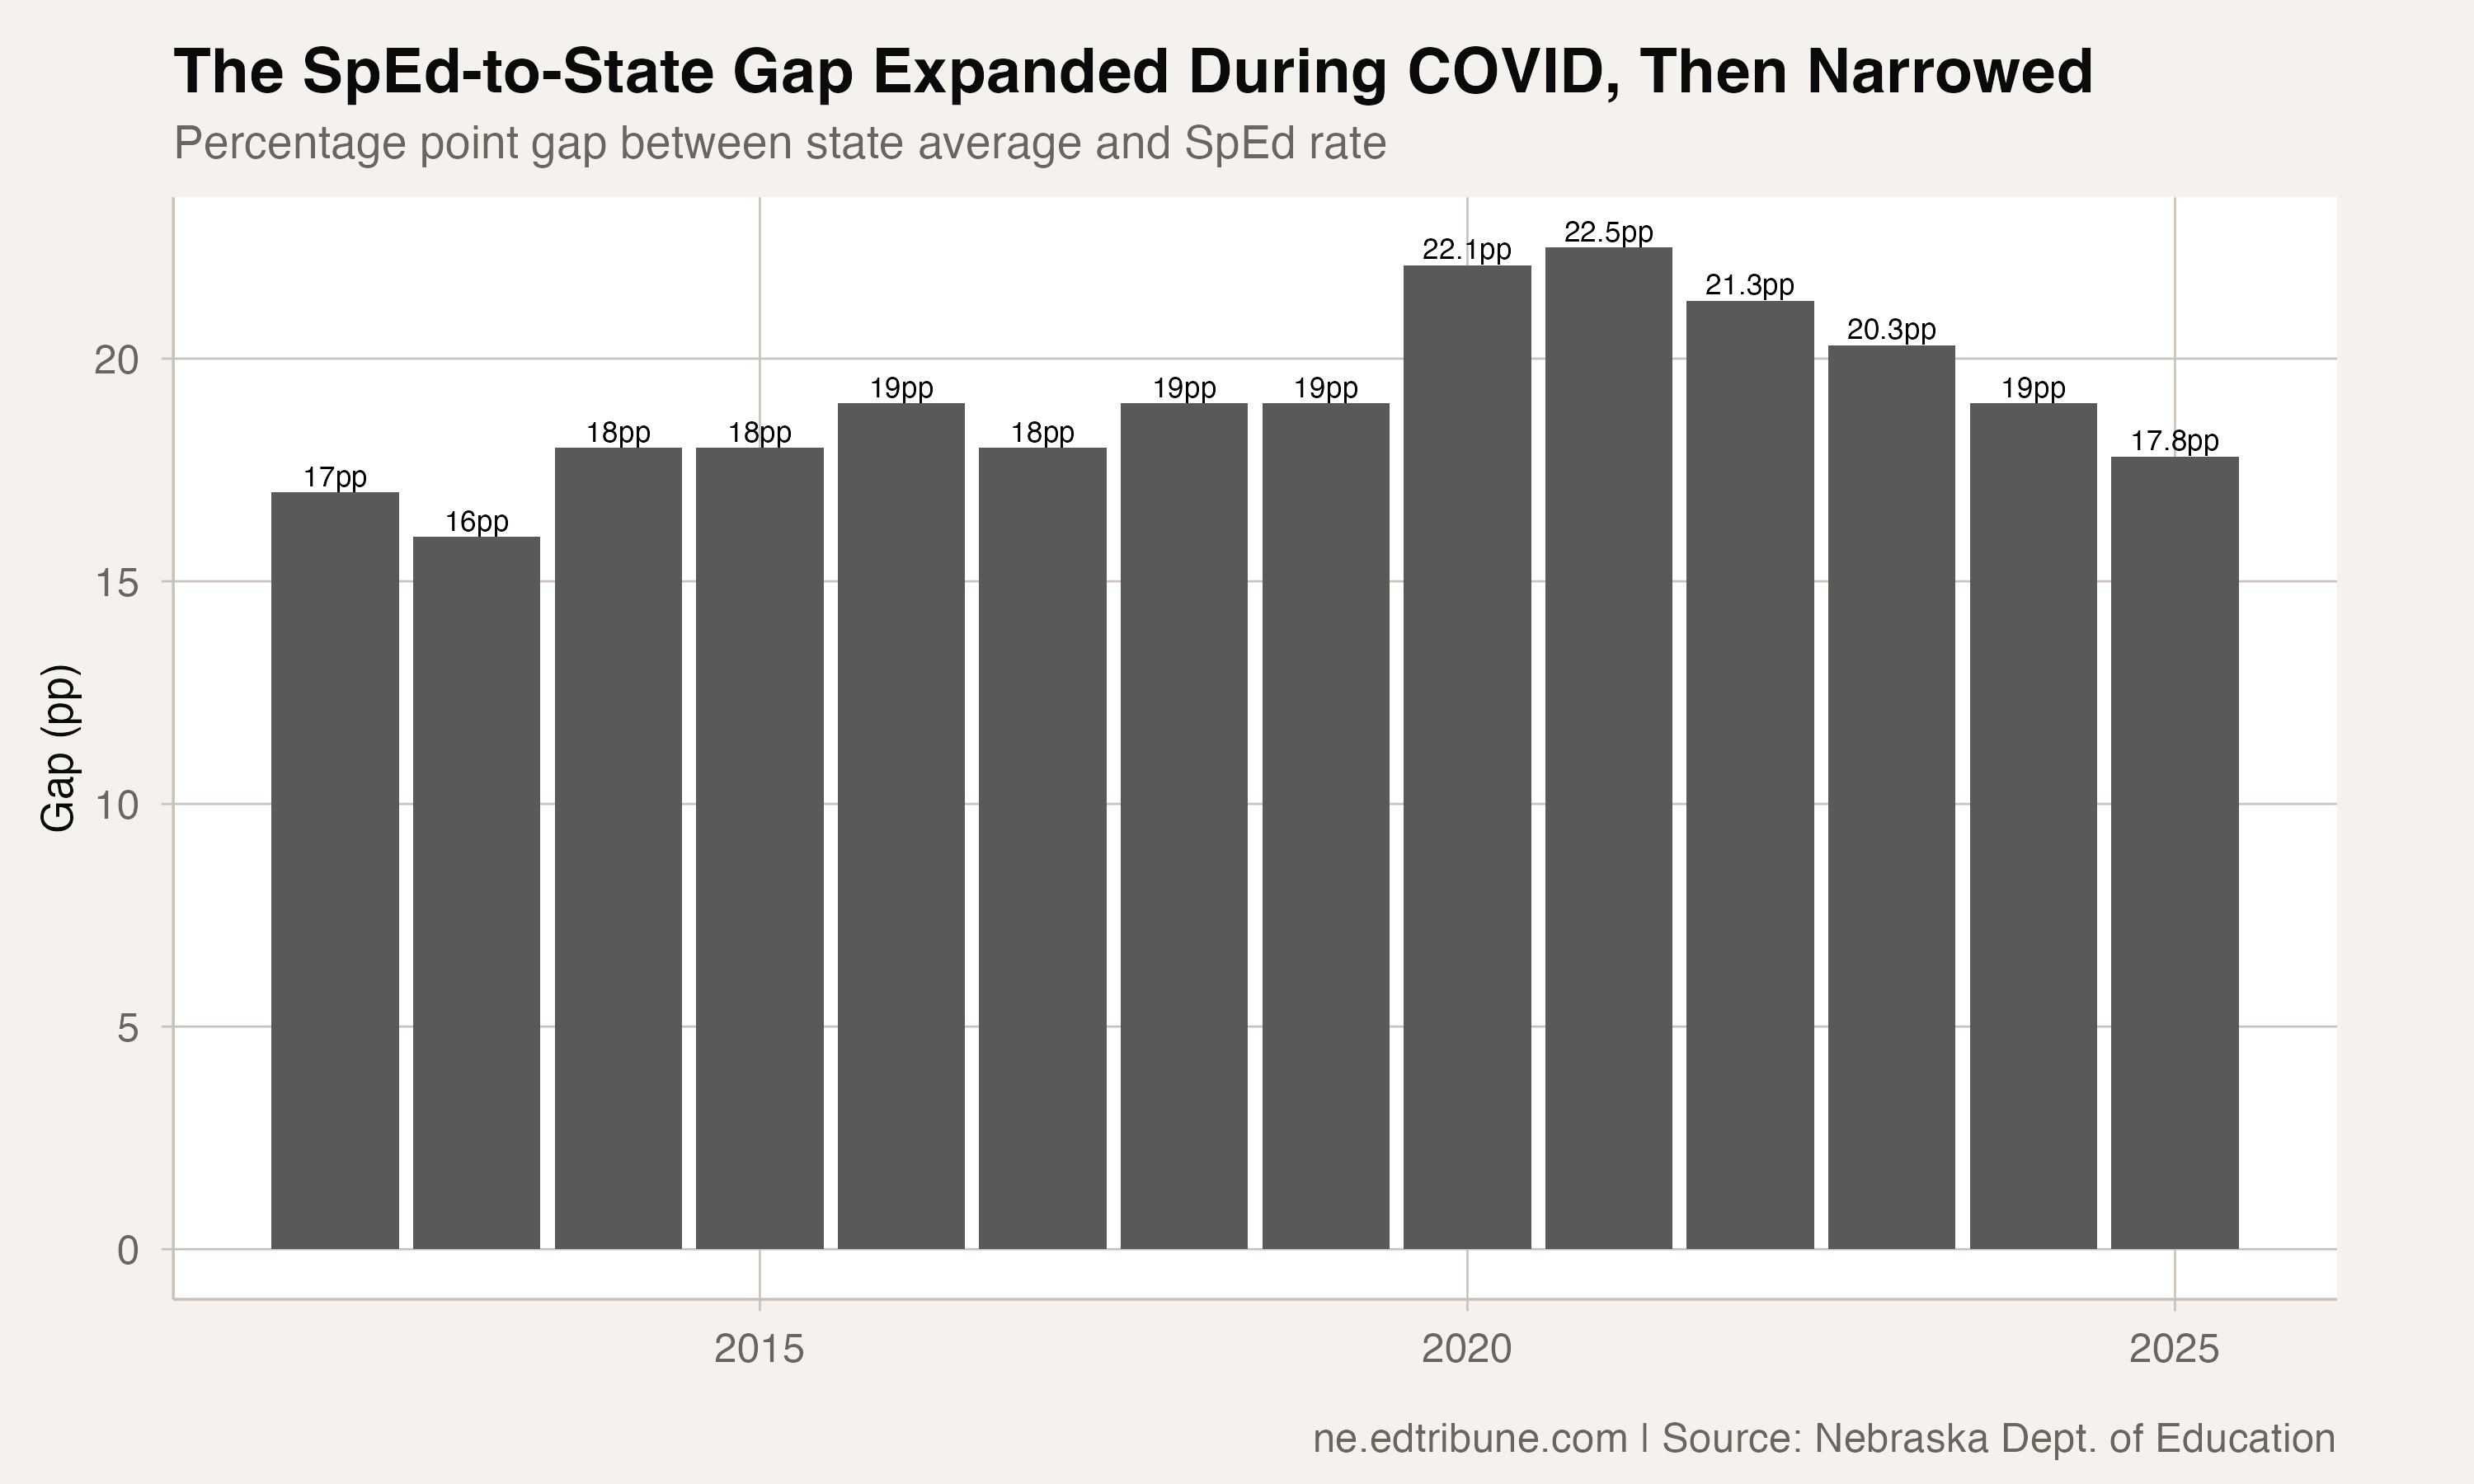
The SpEd-to-state gap tells a more nuanced story than the rate alone. In 2012, the gap was 17 percentage points. It widened gradually through the decade, reaching 19 points by 2019. COVID blew it open to 22.5 points in 2021.
The recovery since has been driven as much by the SpEd rate climbing as by the state rate declining slightly. The 2025 gap of 17.8 points has returned to roughly its 2012 level, but through a different mechanism: both rates are lower now than they were then (70.1% vs. 71% for SpEd, 87.9% vs. 88% for all students).
The question is whether 17-18 points is the structural floor for this gap — a level determined by the fundamental mismatch between a standardized graduation timeline and the diverse needs of students with disabilities.
A growing population
The special education cohort has grown from 2,131 students in 2012 to 2,822 in 2025, a 32.4% increase that outpaces the overall cohort growth of 10.2%. Special education now accounts for 11.7% of the graduating cohort, up from 9.7% in 2012.
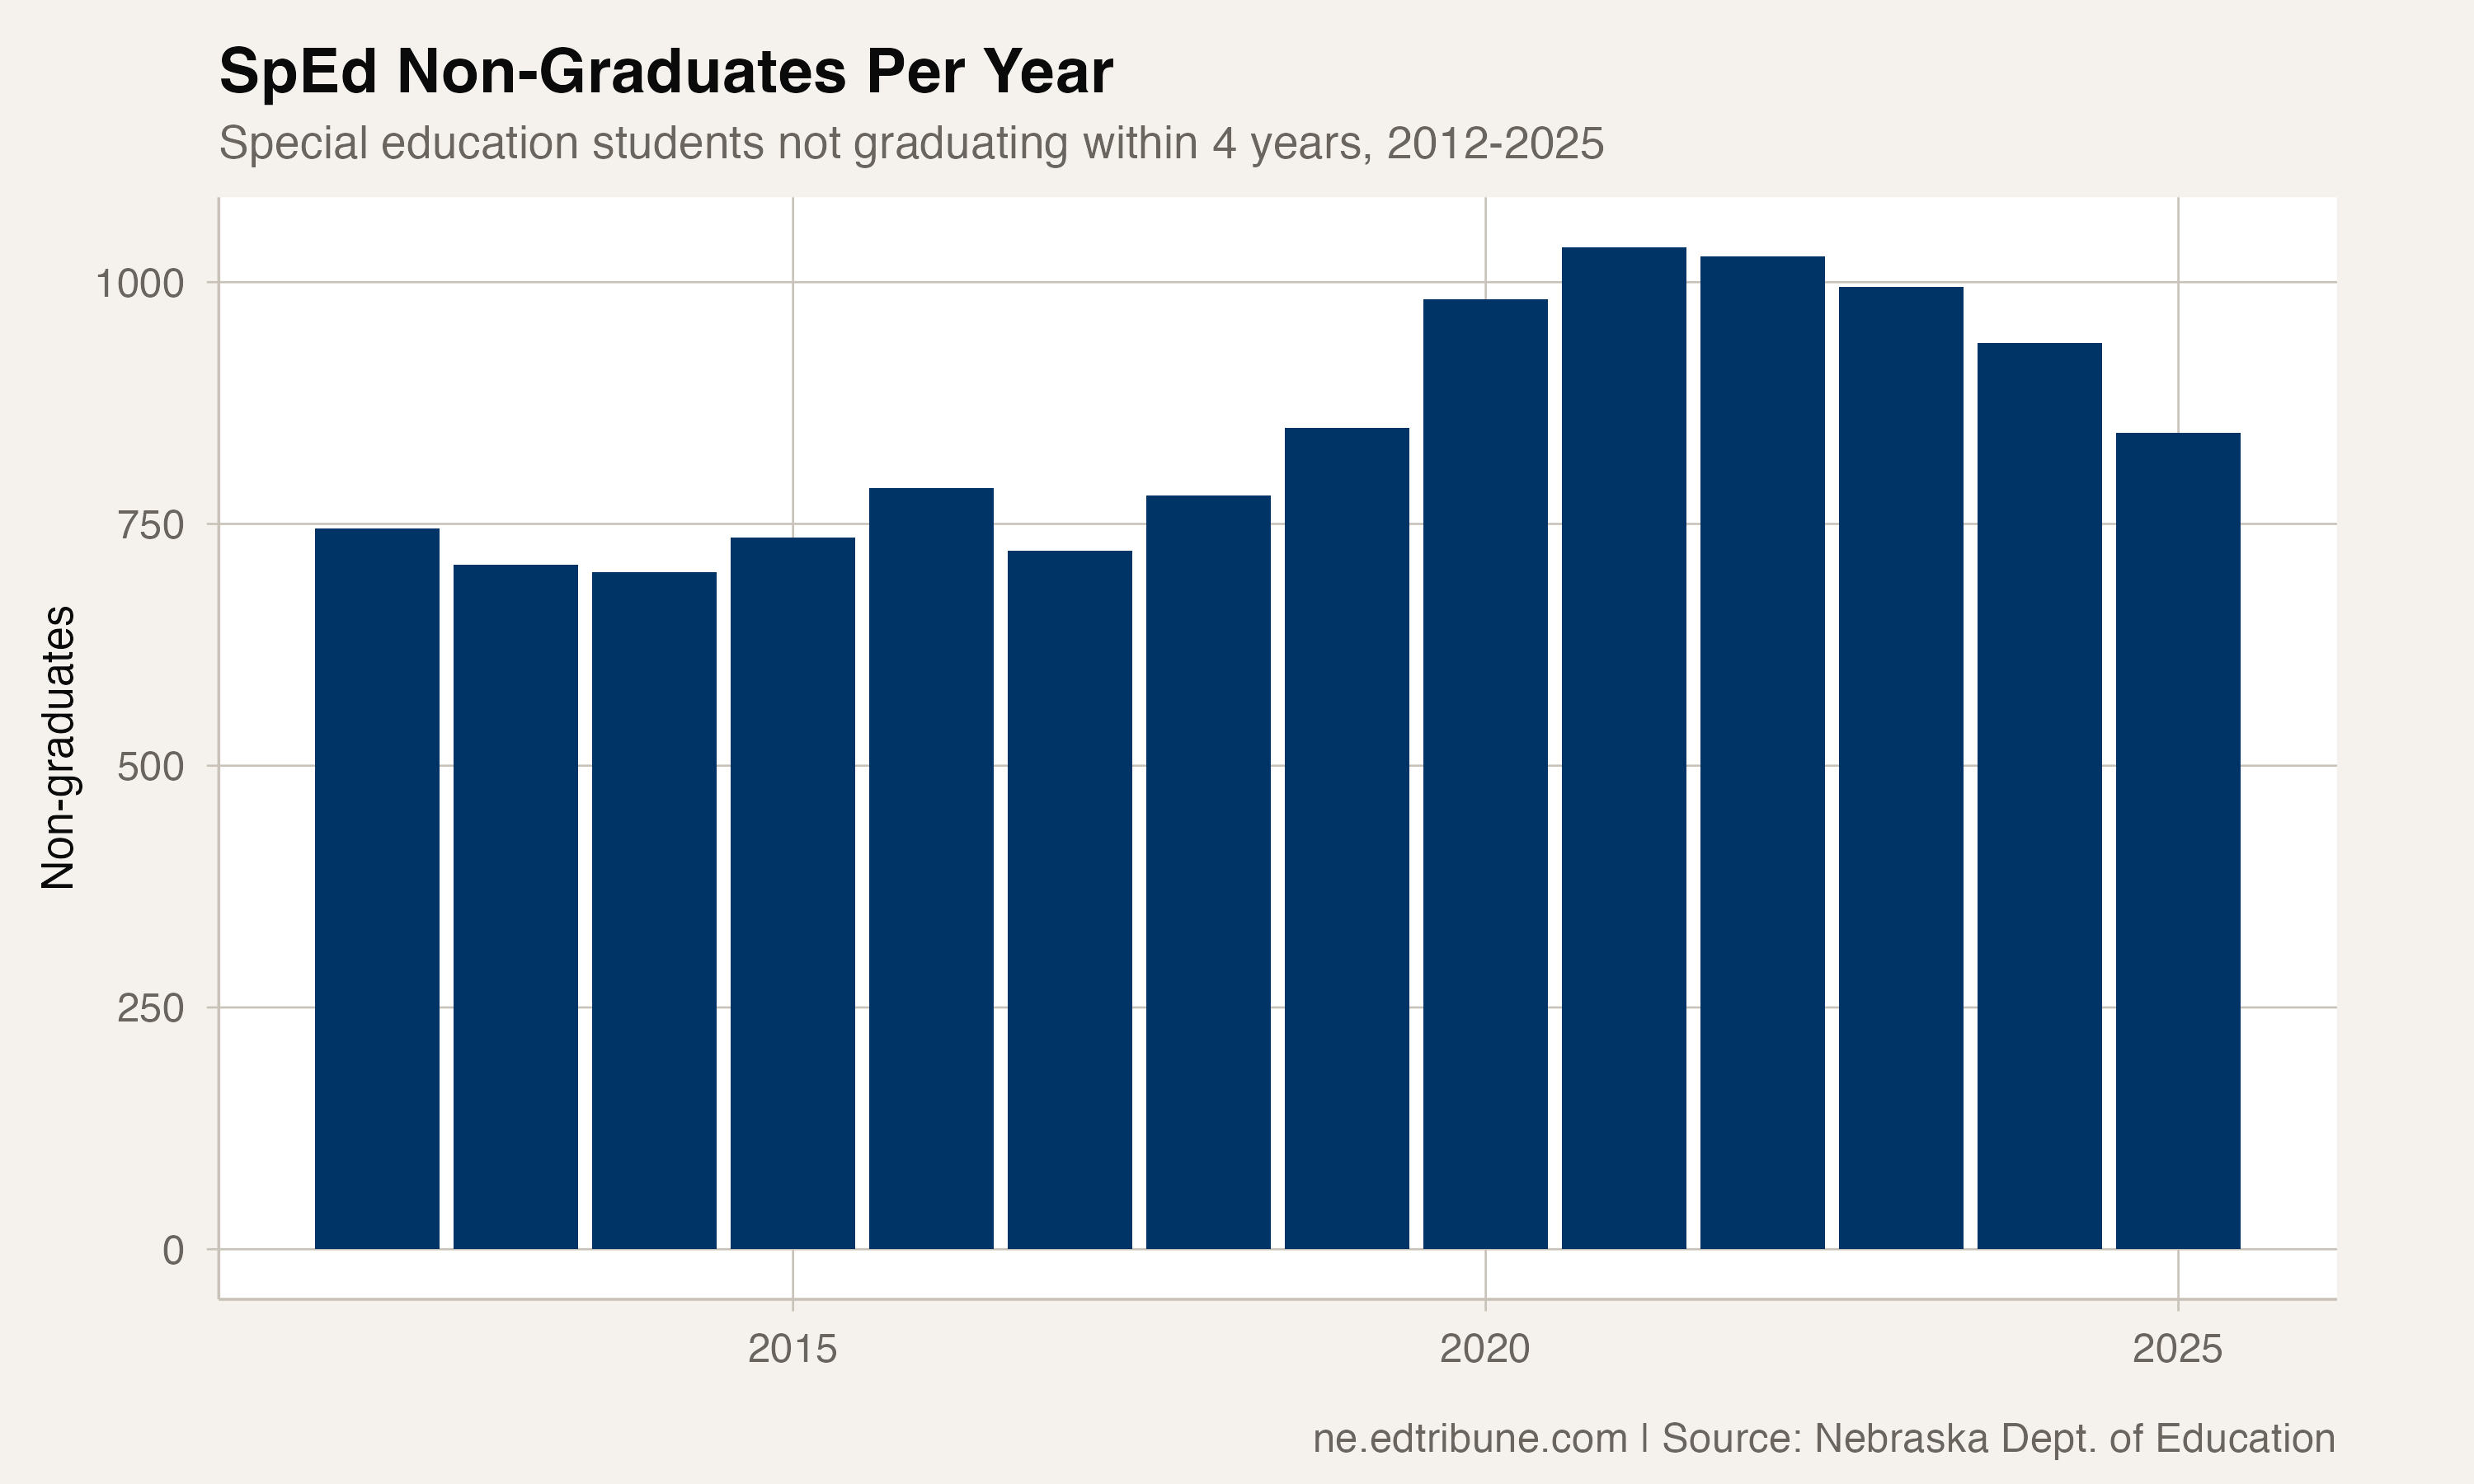
The growing cohort means the number of SpEd non-graduates has remained elevated even as the rate has recovered. In 2019, with a 69% rate applied to 2,599 students, roughly 806 special education students did not graduate on time. In 2025, with a 70.1% rate applied to 2,822 students, roughly 844 did not.
The rate recovered. The number of students falling short barely changed.
Why COVID hit harder
Special education students were disproportionately affected by pandemic disruptions for reasons that are well documented but worth restating. IEP services — speech therapy, occupational therapy, specialized instruction, behavioral support — were difficult or impossible to deliver remotely. Many students with disabilities depend on in-person structure, routine, and one-on-one support that virtual schooling could not replicate.
The 2021 cohort graduated four years after entering high school in fall 2017. These students experienced their junior year entirely during the pandemic and their senior year during the first full year of in-person recovery. For students who needed consistent IEP services to stay on track toward graduation, the disruption was not a temporary inconvenience — it was a structural break in the support system they needed.
The long view
The 14-year trajectory of Nebraska's SpEd graduation rate is one of modest, uneven improvement. The rate was 71% in 2012, climbed to 72% in 2013-2014, then gradually declined to 69% by 2019. The COVID drop accelerated a trend that was already heading downward.
The post-COVID recovery — 65.1% to 70.1% over four years — is genuine progress. But it has taken the rate back to roughly where it was in 2016-2017, not to the highs of 2013-2014. And the gap has narrowed primarily because the state rate has also declined from its 2014 peak.
Special education is the second-widest equity gap in Nebraska's graduation data, trailing only English learners (35.7 points). But unlike the LEP gap, which is widening, the SpEd gap has at least stabilized. The question is whether stabilization at 17-18 points represents progress or the new normal.
Detailed code that reproduces the analysis and figures in this article is available exclusively to EdTribune subscribers.
Discussion
Sign in to join the discussion.
Loading comments...